

Question
There are two goals of this assignment : (1) To get more familiar with data entry and basic statistical operations by repeating the tasks that
There are two goals of this assignment: (1) To get more familiar with data entry and basic statistical operations by repeating the tasks that you performed for the SPSS assignment #1; (2) To learn new data/statistical functions (calculating the mean of several variables for EACH case; z scores; etc.).
Data
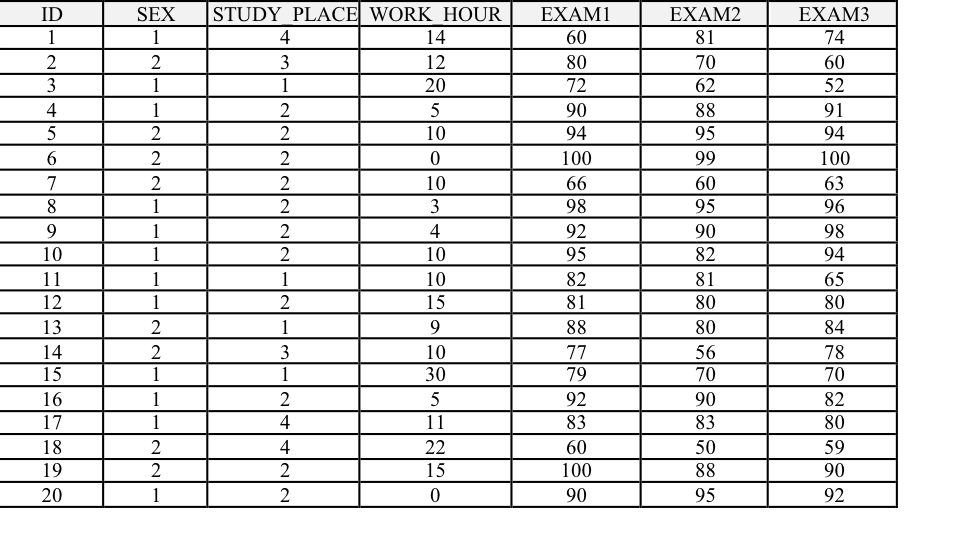
A professor recorded three statistics exam scores and other variables for 20 students in her statistics course. There are seven variables in this data set: (1) ID number, (2) Sex, (3) Study Place, and (4) Hours of Work, (5) Exam 1 score, (6) Exam 2 score, and (7) Exam 3 score.
- Sex (1 = Males, 2 = Females)
- Study_Place (Where do you study the most frequently for this class?
1 = My room, 2 = Library, 3 = Coffee shops, 4 = others)
- Work_Hour (On average, how many hours do you spend for job-related tasks?)
Problem #1 (3 points): Data preparation using SPSS (Statistical Package for the Social Sciences). Create a SPSS data file and enter all information.
- Define (name) the variables (7 variables; Id Exam3). Make sure to add initials of your nameto each variable.
- Enter your data. Either you enter each value or you can copy and paste the values into SPSS data set.
- Label the VALUES: Sex (1 = Males, 2 = Females); Study_Place (1 = My room, 2 = Library, 3 = Coffee shops, 4 = others).
Problem #2 (2 points): Calculate the average (mean) of three exam scores.
Problem #3 (5 points): Calculate the z score of the average exam score for each case.
- (2 points) Show me the scores on all9variables (the original 7 variables, the mean exam score, and its z score) for the first 5cases.
- (1.5 points) What is the z score of mean exam for ID #1? Interpret his z score?
- (1.5 points) Get the mean and SD of the z scores. Review the output; can you locate the mean and SD of the z score distribution? What are the values?
Problem #4 (5 points)
- (1.5 points) Calculate the mean and standard deviation (SD) of the mean exam score separatelyby study place.
- (2 points) Construct a bar-graph for study place. The X-axis represents Study Place and the Y-axis represents MEAN exam score.
- (1.5 point) Review the output from 4-a and 4-b. What conclusion can you draw from them? (for example, Would the location of study be related to average exam score?)
Step by Step Solution
There are 3 Steps involved in it
Step: 1

Get Instant Access to Expert-Tailored Solutions
See step-by-step solutions with expert insights and AI powered tools for academic success
Step: 2

Step: 3
Ace Your Homework with AI
Get the answers you need in no time with our AI-driven, step-by-step assistance
Get Started
Essentials of Database Management
Authors: Jeffrey A. Hoffer, Heikki Topi, Ramesh Venkataraman
1st edition
133405680, 9780133547702 , 978-0133405682