Answered step by step
Verified Expert Solution
Question
1 Approved Answer
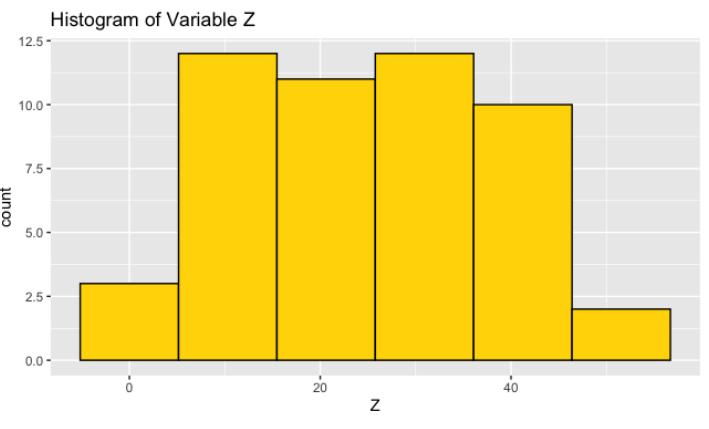
Read the dataset brand_ratings.csv into R. Construct a histogram plot (as below) using variable perform. Hints: you may need to (i.) adjust the binwidth; (ii.)
Read the dataset brand_ratings.csv into R. Construct a histogram plot (as below) using variable perform. Hints: you may need to (i.) adjust the binwidth; (ii.) adjust the aesthetical attributes fill and color; (iii.) facet the histogram in different panels according to the variable brand.


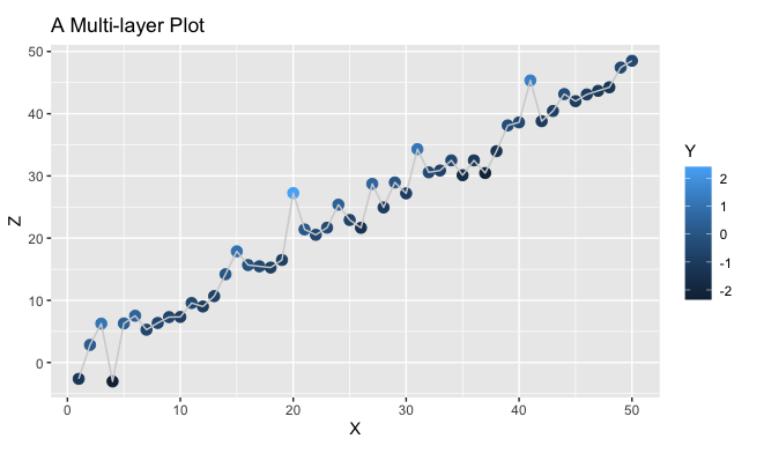
X Z Y 1 -1.20707 -2.6212 2 0.277429 2.832288 3 1.084441 6.253324 4 -2.3457 -3.03709 5 0.429125 6.287374 6 0.506056 7.518168 -0.57474 5.27578 7 8 -0.54663 6.360104 9 -0.56445 7.306644 10 -0.89004 7.329887 11 -0.47719 9.568422 12 -0.99839 9.004841 13 -0.77625 10.67124 14 0.064459 14.19338 15 0.959494 17.87848 16 0.11029 15.66914 17 -0.51101 15.46697 18 -0.9112 15.26641 19 -0.83717 16.48848 20 2.415835 27.24751 21 0.134088 21.40226 22 -0.49069 20.52794 23 -0.44055 21.67836 24 0.459589 25.37877 25 -0.69372 22.91884 26 -1.4482 21.65539 27 0.574756 28.72427 28 -1.02366 24.92903 29 -0.01514 28.95459 30 -0.93595 27.19215 31 1.102298 34.30689 32 -0.47559 30.57322 33 -0.70944 30.87168 -0.50126 32.49623 34 35 -1.62909 30.11272 36 -1.16762 32.49714 37 -2.18004 30.45988 38 -1.34099 33.97702 39 -0.29429 38.11712 40 -0.4659 38.60231 41 1.449496 45.34849 42 -1.06864 38.79407 43 -0.85536 40.43391 44 -0.28062 43.15813 45 -0.99434 42.01698 46 -0.96851 43.09446 47 -1.10732 43.67805 48 -1.25199 44.24404 49 -0.52383 47.42852 50 -0.49685 48.50945
Step by Step Solution
★★★★★
3.30 Rating (162 Votes )
There are 3 Steps involved in it
Step: 1
To construct a histogram plot ...
Get Instant Access to Expert-Tailored Solutions
See step-by-step solutions with expert insights and AI powered tools for academic success
Step: 2

Step: 3

Ace Your Homework with AI
Get the answers you need in no time with our AI-driven, step-by-step assistance
Get Started


