Answered step by step
Verified Expert Solution
Question
1 Approved Answer
There is an accompanying Excel spreadsheet with data that some of the questions below refer to. 1. Basic investments calculations: please turn in your work
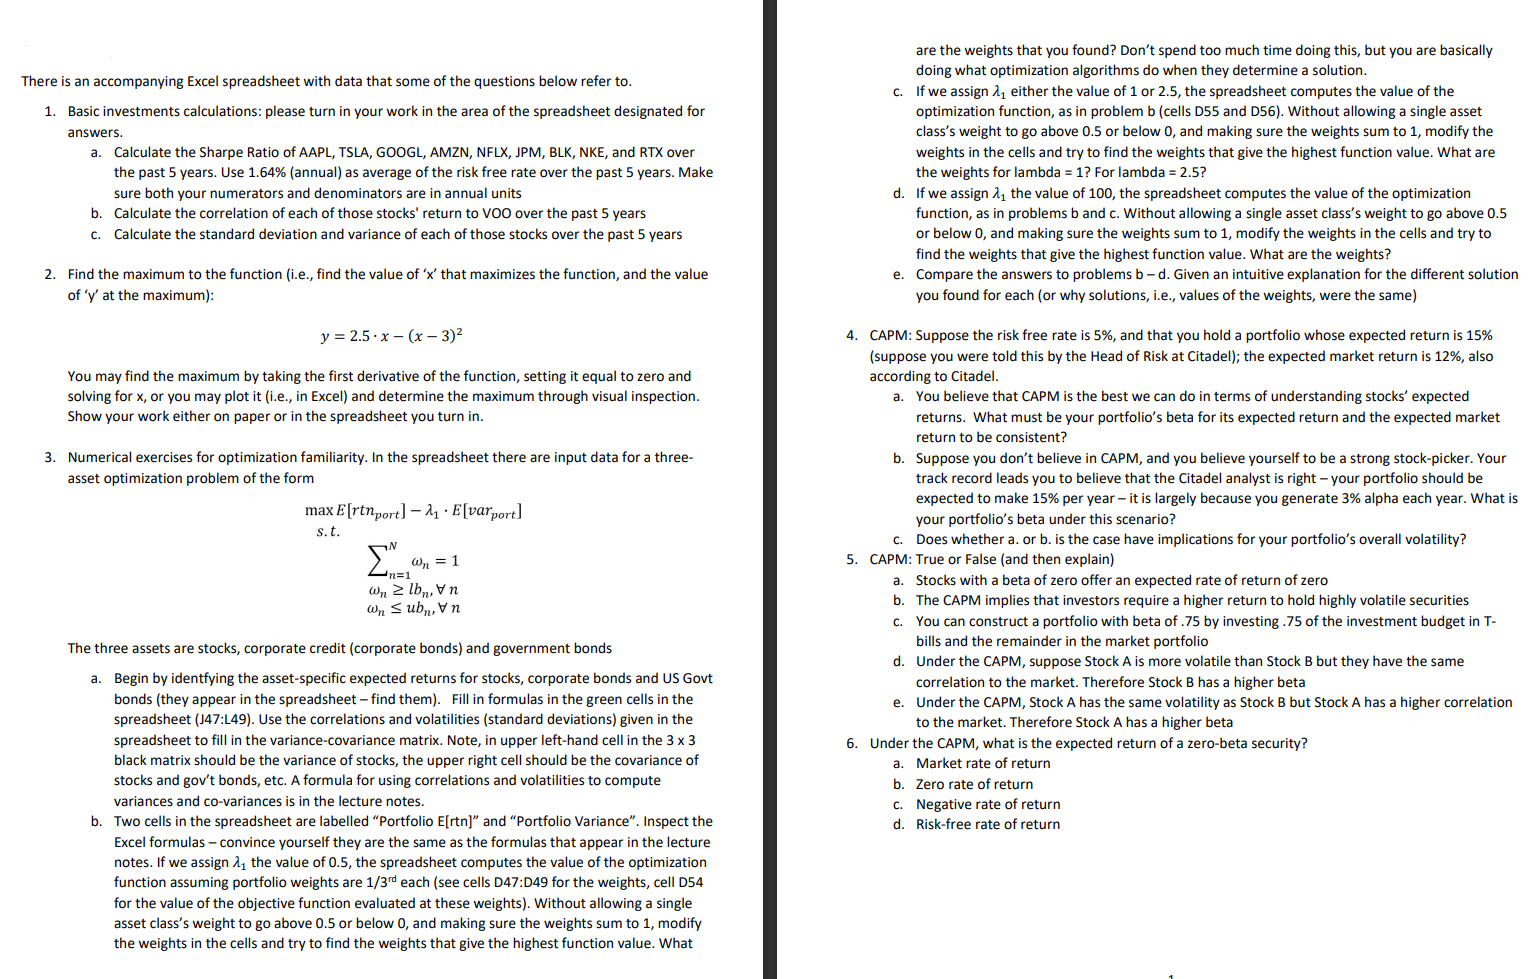
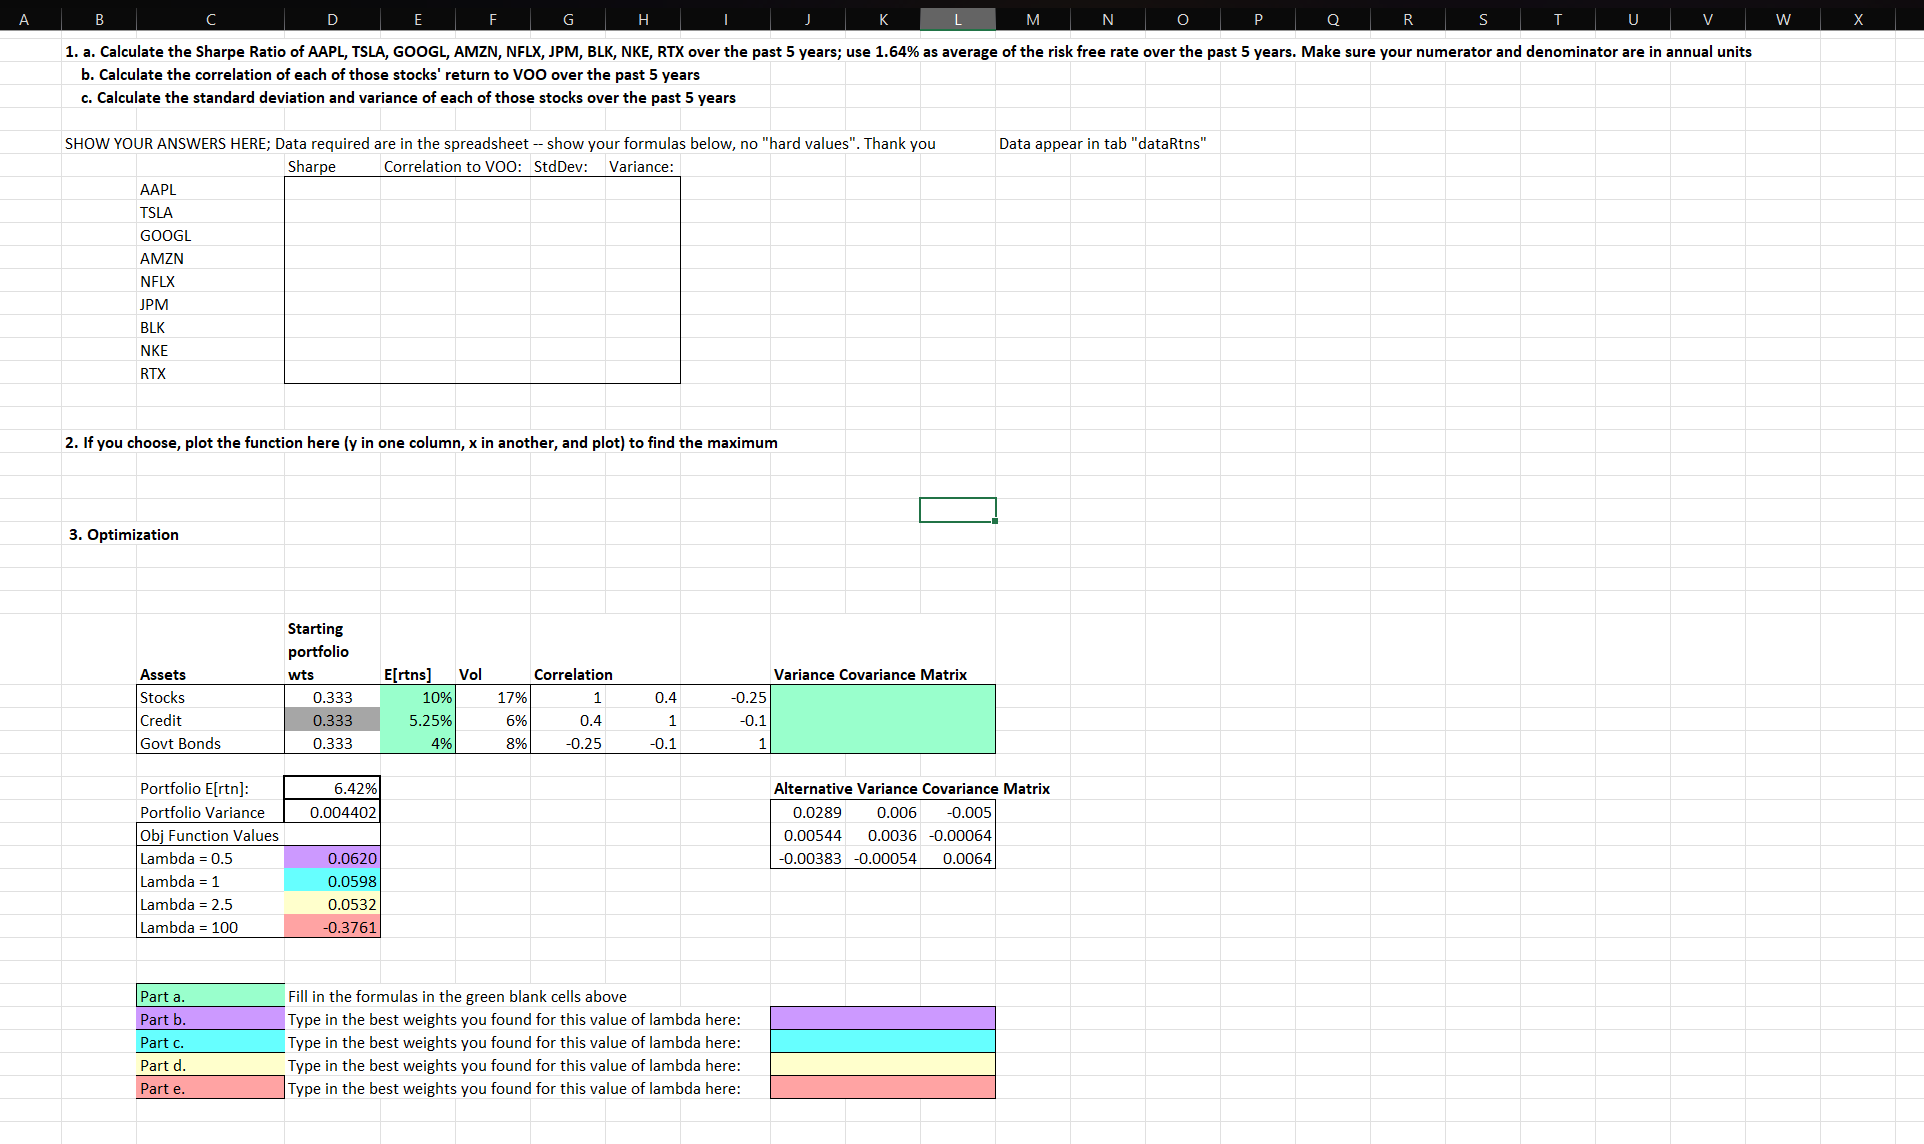 There is an accompanying Excel spreadsheet with data that some of the questions below refer to. 1. Basic investments calculations: please turn in your work in the area of the spreadsheet designated for answers. a. Calculate the Sharpe Ratio of AAPL, TSLA, GOOGL, AMZN, NFLX, JPM, BLK, NKE, and RTX over the past 5 years. Use 1.64\% (annual) as average of the risk free rate over the past 5 years. Make sure both your numerators and denominators are in annual units b. Calculate the correlation of each of those stocks' return to VOO over the past 5 years c. Calculate the standard deviation and variance of each of those stocks over the past 5 years 2. Find the maximum to the function (i.e., find the value of ' x ' that maximizes the function, and the value of ' y ' at the maximum): y=2.5x(x3)2 You may find the maximum by taking the first derivative of the function, setting it equal to zero and solving for x, or you may plot it (i.e., in Excel) and determine the maximum through visual inspection. Show your work either on paper or in the spreadsheet you turn in. 3. Numerical exercises for optimization familiarity. In the spreadsheet there are input data for a threeasset optimization problem of the form maxE[trnport]1E[varport]s.t.n=1Nn=1nlbn,nnubn,n The three assets are stocks, corporate credit (corporate bonds) and government bonds a. Begin by identfying the asset-specific expected returns for stocks, corporate bonds and US Govt bonds (they appear in the spreadsheet - find them). Fill in formulas in the green cells in the spreadsheet (J47:L49). Use the correlations and volatilities (standard deviations) given in the spreadsheet to fill in the variance-covariance matrix. Note, in upper left-hand cell in the 33 black matrix should be the variance of stocks, the upper right cell should be the covariance of stocks and gov't bonds, etc. A formula for using correlations and volatilities to compute variances and co-variances is in the lecture notes. b. Two cells in the spreadsheet are labelled "Portfolio E[rtn]" and "Portfolio Variance". Inspect the Excel formulas - convince yourself they are the same as the formulas that appear in the lecture notes. If we assign 1 the value of 0.5 , the spreadsheet computes the value of the optimization function assuming portfolio weights are 1/3rd each (see cells D47:D49 for the weights, cell D54 for the value of the objective function evaluated at these weights). Without allowing a single asset class's weight to go above 0.5 or below 0 , and making sure the weights sum to 1 , modify the weights in the cells and try to find the weights that give the highest function value. What are the weights that you found? Don't spend too much time doing this, but you are basically doing what optimization algorithms do when they determine a solution. c. If we assign 1 either the value of 1 or 2.5 , the spreadsheet computes the value of the optimization function, as in problem b (cells D55 and D56). Without allowing a single asset class's weight to go above 0.5 or below 0 , and making sure the weights sum to 1 , modify the weights in the cells and try to find the weights that give the highest function value. What are the weights for lambda =1 ? For lambda =2.5 ? d. If we assign 1 the value of 100 , the spreadsheet computes the value of the optimization function, as in problems b and c. Without allowing a single asset class's weight to go above 0.5 or below 0 , and making sure the weights sum to 1 , modify the weights in the cells and try to find the weights that give the highest function value. What are the weights? e. Compare the answers to problems b-d. Given an intuitive explanation for the different solution you found for each (or why solutions, i.e., values of the weights, were the same) 4. CAPM: Suppose the risk free rate is 5%, and that you hold a portfolio whose expected return is 15% (suppose you were told this by the Head of Risk at Citadel); the expected market return is 12%, also according to Citadel. a. You believe that CAPM is the best we can do in terms of understanding stocks' expected returns. What must be your portfolio's beta for its expected return and the expected market return to be consistent? b. Suppose you don't believe in CAPM, and you believe yourself to be a strong stock-picker. Your track record leads you to believe that the Citadel analyst is right - your portfolio should be expected to make 15% per year - it is largely because you generate 3% alpha each year. What is your portfolio's beta under this scenario? c. Does whether a. or b. is the case have implications for your portfolio's overall volatility? 5. CAPM: True or False (and then explain) a. Stocks with a beta of zero offer an expected rate of return of zero b. The CAPM implies that investors require a higher return to hold highly volatile securities c. You can construct a portfolio with beta of .75 by investing .75 of the investment budget in Tbills and the remainder in the market portfolio d. Under the CAPM, suppose Stock A is more volatile than Stock B but they have the same correlation to the market. Therefore Stock B has a higher beta e. Under the CAPM, Stock A has the same volatility as Stock B but Stock A has a higher correlation to the market. Therefore Stock A has a higher beta 6. Under the CAPM, what is the expected return of a zero-beta security? a. Market rate of return b. Zero rate of return c. Negative rate of return d. Risk-free rate of return 2. If you choose, plot the function here ( y in one column, x in another, and plot) to find the maximum 3. Optimization There is an accompanying Excel spreadsheet with data that some of the questions below refer to. 1. Basic investments calculations: please turn in your work in the area of the spreadsheet designated for answers. a. Calculate the Sharpe Ratio of AAPL, TSLA, GOOGL, AMZN, NFLX, JPM, BLK, NKE, and RTX over the past 5 years. Use 1.64\% (annual) as average of the risk free rate over the past 5 years. Make sure both your numerators and denominators are in annual units b. Calculate the correlation of each of those stocks' return to VOO over the past 5 years c. Calculate the standard deviation and variance of each of those stocks over the past 5 years 2. Find the maximum to the function (i.e., find the value of ' x ' that maximizes the function, and the value of ' y ' at the maximum): y=2.5x(x3)2 You may find the maximum by taking the first derivative of the function, setting it equal to zero and solving for x, or you may plot it (i.e., in Excel) and determine the maximum through visual inspection. Show your work either on paper or in the spreadsheet you turn in. 3. Numerical exercises for optimization familiarity. In the spreadsheet there are input data for a threeasset optimization problem of the form maxE[trnport]1E[varport]s.t.n=1Nn=1nlbn,nnubn,n The three assets are stocks, corporate credit (corporate bonds) and government bonds a. Begin by identfying the asset-specific expected returns for stocks, corporate bonds and US Govt bonds (they appear in the spreadsheet - find them). Fill in formulas in the green cells in the spreadsheet (J47:L49). Use the correlations and volatilities (standard deviations) given in the spreadsheet to fill in the variance-covariance matrix. Note, in upper left-hand cell in the 33 black matrix should be the variance of stocks, the upper right cell should be the covariance of stocks and gov't bonds, etc. A formula for using correlations and volatilities to compute variances and co-variances is in the lecture notes. b. Two cells in the spreadsheet are labelled "Portfolio E[rtn]" and "Portfolio Variance". Inspect the Excel formulas - convince yourself they are the same as the formulas that appear in the lecture notes. If we assign 1 the value of 0.5 , the spreadsheet computes the value of the optimization function assuming portfolio weights are 1/3rd each (see cells D47:D49 for the weights, cell D54 for the value of the objective function evaluated at these weights). Without allowing a single asset class's weight to go above 0.5 or below 0 , and making sure the weights sum to 1 , modify the weights in the cells and try to find the weights that give the highest function value. What are the weights that you found? Don't spend too much time doing this, but you are basically doing what optimization algorithms do when they determine a solution. c. If we assign 1 either the value of 1 or 2.5 , the spreadsheet computes the value of the optimization function, as in problem b (cells D55 and D56). Without allowing a single asset class's weight to go above 0.5 or below 0 , and making sure the weights sum to 1 , modify the weights in the cells and try to find the weights that give the highest function value. What are the weights for lambda =1 ? For lambda =2.5 ? d. If we assign 1 the value of 100 , the spreadsheet computes the value of the optimization function, as in problems b and c. Without allowing a single asset class's weight to go above 0.5 or below 0 , and making sure the weights sum to 1 , modify the weights in the cells and try to find the weights that give the highest function value. What are the weights? e. Compare the answers to problems b-d. Given an intuitive explanation for the different solution you found for each (or why solutions, i.e., values of the weights, were the same) 4. CAPM: Suppose the risk free rate is 5%, and that you hold a portfolio whose expected return is 15% (suppose you were told this by the Head of Risk at Citadel); the expected market return is 12%, also according to Citadel. a. You believe that CAPM is the best we can do in terms of understanding stocks' expected returns. What must be your portfolio's beta for its expected return and the expected market return to be consistent? b. Suppose you don't believe in CAPM, and you believe yourself to be a strong stock-picker. Your track record leads you to believe that the Citadel analyst is right - your portfolio should be expected to make 15% per year - it is largely because you generate 3% alpha each year. What is your portfolio's beta under this scenario? c. Does whether a. or b. is the case have implications for your portfolio's overall volatility? 5. CAPM: True or False (and then explain) a. Stocks with a beta of zero offer an expected rate of return of zero b. The CAPM implies that investors require a higher return to hold highly volatile securities c. You can construct a portfolio with beta of .75 by investing .75 of the investment budget in Tbills and the remainder in the market portfolio d. Under the CAPM, suppose Stock A is more volatile than Stock B but they have the same correlation to the market. Therefore Stock B has a higher beta e. Under the CAPM, Stock A has the same volatility as Stock B but Stock A has a higher correlation to the market. Therefore Stock A has a higher beta 6. Under the CAPM, what is the expected return of a zero-beta security? a. Market rate of return b. Zero rate of return c. Negative rate of return d. Risk-free rate of return 2. If you choose, plot the function here ( y in one column, x in another, and plot) to find the maximum 3. Optimization
 Step by Step Solution
There are 3 Steps involved in it
Step: 1

Get Instant Access to Expert-Tailored Solutions
See step-by-step solutions with expert insights and AI powered tools for academic success
Step: 2

Step: 3
Ace Your Homework with AI
Get the answers you need in no time with our AI-driven, step-by-step assistance
Get Started