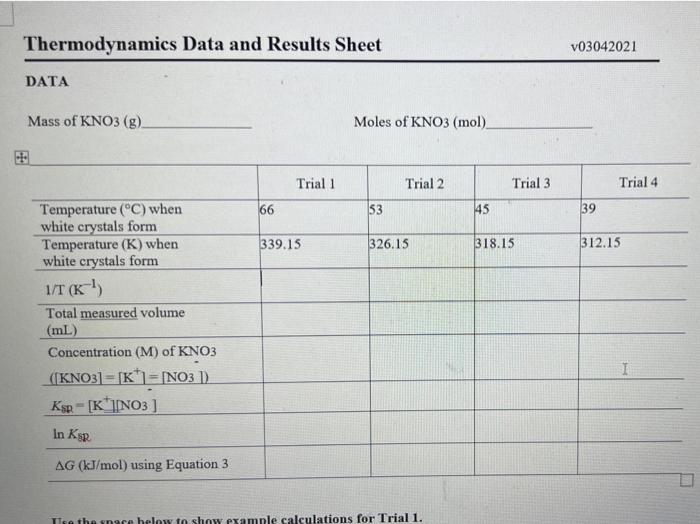
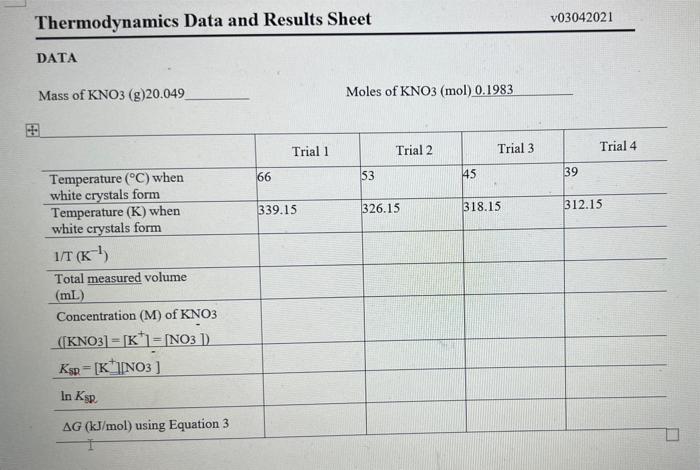
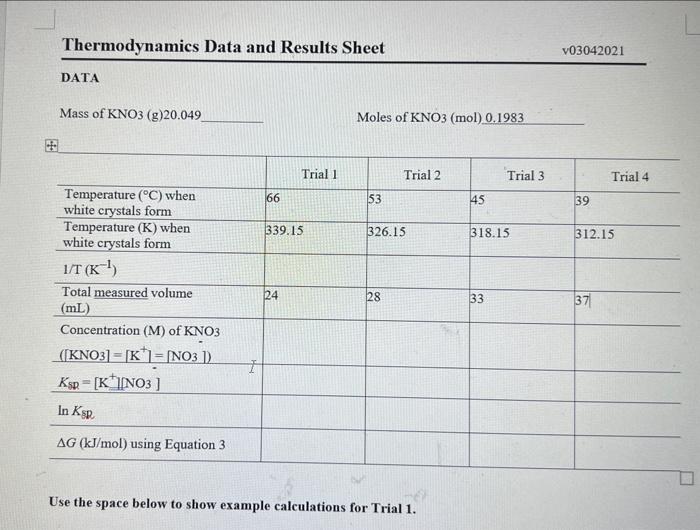
Thermodynamics Data and Results Sheet v03042021 DATA Mass of KNO3 (g). Moles of KNO3 (mol) Trial 1 Trial 2 Trial 3 Trial 4 66 53 45 39 339.15 326.15 318.15 312.15 Temperature (C) when white crystals form Temperature (K) when white crystals form 1/T (K) Total measured volume (mL) Concentration (M) of KNO3 ([KNO3] = [K]=[NO3 D. Ksp - [K|NO3 ] In KER AG (kJ/mol) using Equation 3 Tlso the pure below to show example calculations for Trial 1. Thermodynamics Data and Results Sheet v03042021 DATA Mass of KNO3 (g)20.049 Moles of KNO3 (mol) 0.1983 Trial 1 Trial 2 Trial 3 Trial 4 66 53 45 39 326.15 339.15 318.15 312.15 Temperature (C) when white crystals form Temperature (K) when white crystals form 1/T (K) Total measured volume (mL) Concentration (M) of KNO3 ([KNO3] = [K]= NO3 ]). Ksp = [ KNO3 ] In Ksp. AG (kJ/mol) using Equation 3 Thermodynamics Data and Results Sheet v03042021 DATA Mass of KNO3 (g)20.049 Moles of KNO3 (mol) 0.1983 Trial 1 Trial Trial 3 Trial 4 66 53 45 39 339.15 326.15 318.15 312.15 Temperature (C) when white crystals form Temperature (K) when white crystals form 1/T (K) Total measured volume (mL) Concentration (M) of KNO3 (KNO3] = [K] = NO3 ). Ksp = [ KNO3 ] 24 28 33 37 1 In Ksp AG (kJ/mol) using Equation 3 Use the space below to show example calculations for Trial 1. RESULTS 1. Plot In Ksp as a function of 1/T and insert an image of the graph below. Make sure it is large enough to read and includes a line-of-best-fit, equation, and R2 value. 2. Use the equation from your graph and Equation 6 to calculate AH (in kJ/mol) and AS (in J/mol:K) Show your work. 3. Use the AH and AS values from Q2 to calculate AG (in kJ/mol) using Equation 4. Show your work 4. Comment on the similarity or difference in the AG value calculated in Q3 and the AG values calculated in the table above