these are the correct exhibits
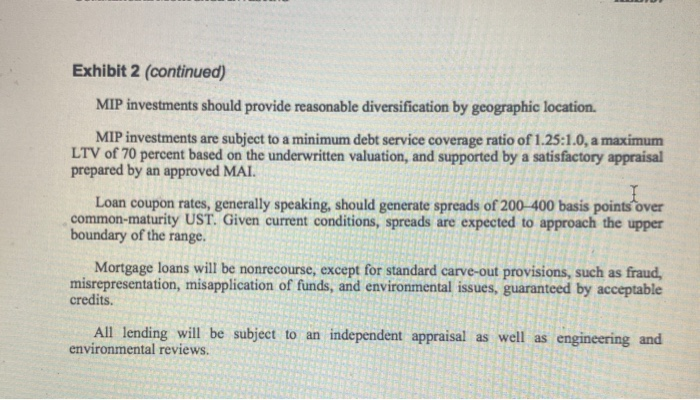
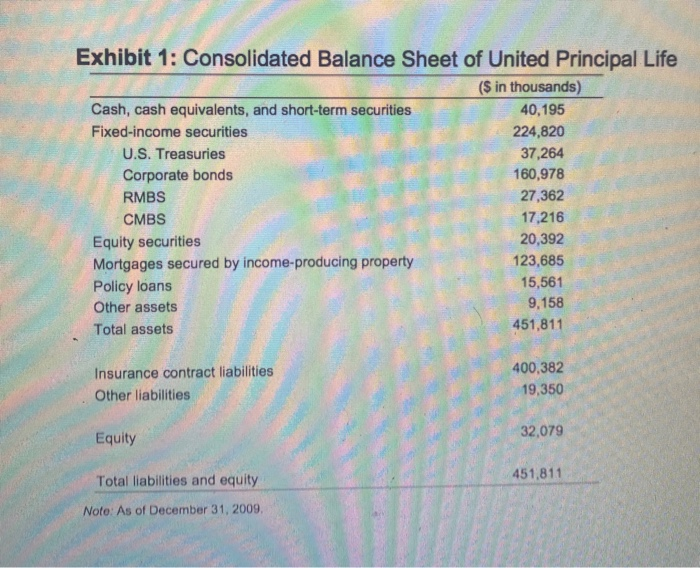
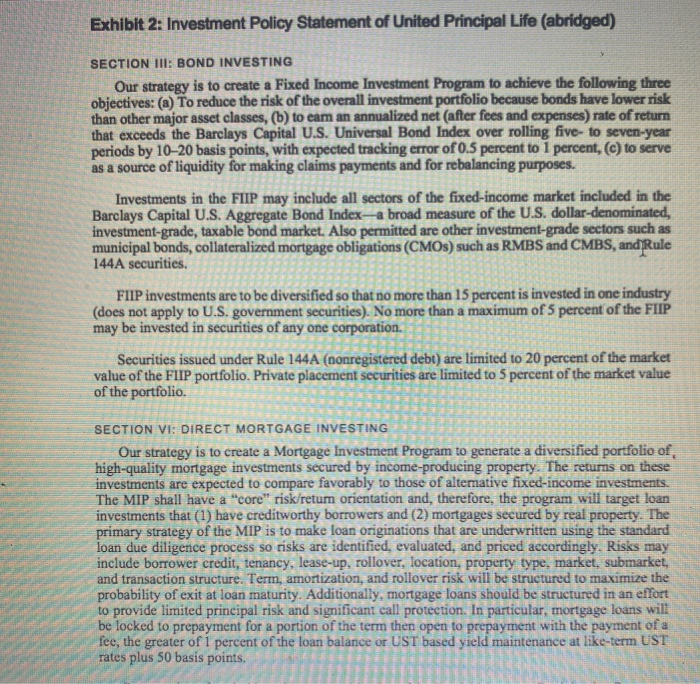
2. By reference to UPL's Balance Sheet (exhibit 1), Investment Policy Statement (exhibit 2) and other references in the body of the case, undertake the following analyses: 1. Discuss the firm's investment profile (relative risk aversion) 2. Evaluate UPL's experience with mortgage-related investment products. You may employ exhibit 3 to throw some light on your evaluation. Exhibit1 Sources and Uses of Revenues, Jefferson County 292865 38.0365 48,472 S 74,756 S 36,309 $ 17,204 S 7,760 $ 184,501 $ 18.10 $ 4.299 $ 188,627 $ 54,973 $ 83,810 $ 40,331 S 12,735 5 8,056 $ 199,905 S 50 SOURCES Local Revenues Property Taxes Sales & Use Taxes Occupational Tax Local Taxes and Miscellaneous Interest Ramings Subtotal Charges for Services Environmental Services County Hospital Revenue County Nursing Home Revenue Courts & Public Safety General Government Subtotal State Revenue Gasoline Tax Allocated Portion of State Taxes Subtotal Federal Revenue Total Sources 45,428 $ 33,448 $ 10,683 S 4,312 5 23,477 $ 117,348 S 48,2915 27,509 $ 10,075 5 5,809 25,1105 116.794 5 39.9655 8,1795 4054 24,9415 130,0275 5,244 S 136225 5,012 $ 11,0495 16,061S 6,877 5 324,787 5 5.1255 11.6585 16,783 S 90745 331 278 S $ USES Operating Services: General Government Courts & Public Safety Health & Public Welfare Public Works Subtotal Debt Service: Principal Interest and Fees Capital Cash Payments Subtotal Total Uses 78,794 $ 48, 195$ 99,691 $ 86,829 $ 313.509 $ 74,3345 49,548 5 95.118 5 81,557 5 300.557 5 76,3575 49.8195 102.076 S 76,450 S 304,025 312.039 4,995 19,605 S 3,868 $ 28.4685 341,9775 8,285 S 11,815 S 2,3375 224175 23.663 6,489 s 18475 3,227 s 280163 S 322.994 $ 2655 Cash (Outflow) Inflow Beginning Fund Balance Ending Fund Balance (17.190) 288.6875 22 555 8.284 271497 279.7515 Source: Note: 19%-A General Obligation Official Statement *1995 figures unaudited Exhibit 2 Jefferson County Sewer-Backed Debt as of 1995-A Bond Issuance Warrants through September 30, 2025 The following table set forth the del service on the Senior Dalf and the Series 1995 add due to rounding) Series 1995-A Warrants Total Debt Service Total Debt Service on Senior Indenture SRF Warrant Total Senior Payable From ervice Warrants Debt Service System Revenues Fiscal Year Interest Principal 51.111.563 $11.793,078 $13,999,745 1995 $2,166,667 $8,689,515 $8,668,555 $12.807,443 $4,138,888 $6,500,000 $19,307,443 1996 $19.297,809 $12.797,809 54.136.229 $8,661,580 $6,500,000 1997 $19,305,519 $12,805,519 $6,500,000 1998 $8,670,088 5,135431 $8,658,868 $6,500,000 54.136,293 $19,295,161 $12.795,161 1999 $4,138,610 $8,668,908 $6,500,000 $19,307 518 $12,807,518 2000 $6,500,000 $8,662,948 2001 54.137.283 $12.800,231 $19,300 231 2002 58,665,313 $6,500,000 $19,302,522 $4,137,209 $12,802,522 $8.665,730 $6,500,000 2003 $12,803,916 $4.138, 186 $19,303,916 2004 56.500,000 $8,666,230 $4,135.114 $12.801.344 $19,301,344 2005 $6,500,000 55,805 270 54,137,789 $12.943,099 $19.463,099 2006 $6,500,000 58.661,383 $4.136,009 $12.797,392 $19.297 392 2007 $6,500,000 $8,671,583 $ ,139,571 $12,811,154 $19.311,154 2008 $6,500,000 58.666,350 3:54.138,274 $12.804,624 519 304,624 2009 $6,500,000 $8,773,650 $4,137.015 $12,910,665 $19.410.565 2010 $6.500.000 $8,779,900 54.135,593 $12.915.493 519,415.493 2011 $6,500,000 $8.777,600 $4,138,703 $12.916,303 519.416,303 2012 $6,500,000 58,775,400 54.136,143 $12.911,543 519.411,543 2013 56,500,000 58.776.800 54,137,710 $12.914.510 $19.414,510 2014 $8,775,000 = $6,500,000 $4,138,101 $4.138.101 519.413,101 2015 $8,775,000 56,061.250 $4,137,114 $4,137,114 518,973,364 2016 $11,245,000 $5,622,500 $16.567.500 $11,245,000 $5,060,250 2018 $16.305.250 511,245,000 54.498,000 $15.743.000 $11,245,000 $3,935,750 $15.180.750 2020 $11,245,000 $3,373,500 2021 $11,245,000 $14,618.500 $2,811,250 2022 $11,245,000 $14.656250 $2,249.000 2023 $11,245,000 $1.686750 $1494 2024 $123 51.124,500 2025 $11,245,000 $562 512369 50 TOTAL 5110 SC 5130,000,000 $162,651,667 $165,335,671 5251.214495 $53.866.162 2017 2019 In rest on the series 1995-A Warrants has been calculated based upon med rates. 1995-A Warrants will be variable, actual debt service may vary from this time Iecause the interest t o the end Source: Official Statement for Series 1995-A warrants Exhibit 1: Consolidated Balance Sheet of United Principal Life ($ in thousands) Cash, cash equivalents, and short-term securities 40,195 Fixed-income securities 224,820 U.S. Treasures 37,264 Corporate bonds 160,978 RMBS 27,362 CMBS 17,216 Equity securities 20,392 Mortgages secured by income-producing property 123,685 Policy loans 15,561 Other assets 9,158 Total assets 451,811 Insurance contract liabilities Other liabilities 400,382 19,350 Equity 32,079 451,811 Total liabilities and equity Note: As of December 31, 2009, Exhibit 2: Investment Policy Statement of United Principal Life (abridged) SECTION III: BOND INVESTING Our strategy is to create a Fixed Income Investment Program to achieve the following three objectives: (a) To reduce the risk of the overall investment portfolio because bonds have lower risk than other major asset classes, (b) to eam an annualized net (after fees and expenses) rate of return that exceeds the Barclays Capital U.S. Universal Bond Index over rolling five- to seven-year periods by 10-20 basis points, with expected tracking error of 0.5 percent to 1 percent, (c) to serve as a source of liquidity for making claims payments and for rebalancing purposes. Investments in the FIIP may include all sectors of the fixed-income market included in the Barclays Capital U.S. Aggregate Bond Index-a broad measure of the U.S. dollar-denominated, investment-grade, taxable bond market. Also permitted are other investment-grade sectors such as municipal bonds, collateralized mortgage obligations (CMOs) such as RMBS and CMBS, and Rule 144A securities. FIIP investments are to be diversified so that no more than 15 percent is invested in one industry (does not apply to U.S. government securities). No more than a maximum of 5 percent of the FIIP may be invested in securities of any one corporation Securities issued under Rule 144A (nonregistered debt) are limited to 20 percent of the market value of the FIIP portfolio. Private placement securities are limited to 5 percent of the market value of the portfolio. SECTION VI: DIRECT MORTGAGE INVESTING Our strategy is to create a Mortgage Investment Program to generate a diversified portfolio of high-quality mortgage investments secured by income-producing property. The returns on these investments are expected to compare favorably to those of alternative fixed-income investments. The MIP shall have a "core" risk/retum orientation and, therefore, the program will target loan investments that (1) have creditworthy borrowers and (2) mortgages secured by real property. The primary strategy of the MIP is to make loan originations that are underwritten using the standard loan due diligence process so risks are identified, evaluated, and priced accordingly. Risks may include borrower credit, tenancy, lease-up, rollover, location, property type, market, submarket, and transaction structure. Term, amortization, and rollover risk will be structured to maximize the probability of exit at loan maturity. Additionally, mortgage loans should be structured in an effort to provide limited principal risk and significant call protection. In particular, mortgage loans will be locked to prepayment for a portion of the term then open to prepayment with the payment of a fee, the greater of 1 percent of the loan balance or UST based yield maintenance at like-term UST rates plus 50 basis points. Preservation of capital is an important objective of the Funds' Mortgage Participation Program. As such, high-quality, fixed-rate loans generally are preferred. No participating loans, mezzanine debt, or second mortgage loans are permitted under this policy. Moderate leasing risk is acceptable. Substantial preleasing will be required on forward commitment loans. Loans on operating properties generally require higher, stabilized levels of occupancy of at least 85 percent. Exhibit 2 (continued) MIP investments should provide reasonable diversification by geographic location. MIP investments are subject to a minimum debt service coverage ratio of 1.25:1.0, a maximum LTV of 70 percent based on the underwritten valuation, and supported by a satisfactory appraisal prepared by an approved MAI Loan coupon rates, generally speaking, should generate spreads of 200-400 basis points over common-maturity UST. Given current conditions, spreads are expected to approach the upper boundary of the range. Mortgage loans will be nonrecourse, except for standard carve-out provisions, such as fraud, misrepresentation, misapplication of funds, and environmental issues, guaranteed by acceptable credits. All lending will be subject to an independent appraisal as well as engineering and environmental reviews 2. By reference to UPL's Balance Sheet (exhibit 1), Investment Policy Statement (exhibit 2) and other references in the body of the case, undertake the following analyses: 1. Discuss the firm's investment profile (relative risk aversion) 2. Evaluate UPL's experience with mortgage-related investment products. You may employ exhibit 3 to throw some light on your evaluation. Exhibit1 Sources and Uses of Revenues, Jefferson County 292865 38.0365 48,472 S 74,756 S 36,309 $ 17,204 S 7,760 $ 184,501 $ 18.10 $ 4.299 $ 188,627 $ 54,973 $ 83,810 $ 40,331 S 12,735 5 8,056 $ 199,905 S 50 SOURCES Local Revenues Property Taxes Sales & Use Taxes Occupational Tax Local Taxes and Miscellaneous Interest Ramings Subtotal Charges for Services Environmental Services County Hospital Revenue County Nursing Home Revenue Courts & Public Safety General Government Subtotal State Revenue Gasoline Tax Allocated Portion of State Taxes Subtotal Federal Revenue Total Sources 45,428 $ 33,448 $ 10,683 S 4,312 5 23,477 $ 117,348 S 48,2915 27,509 $ 10,075 5 5,809 25,1105 116.794 5 39.9655 8,1795 4054 24,9415 130,0275 5,244 S 136225 5,012 $ 11,0495 16,061S 6,877 5 324,787 5 5.1255 11.6585 16,783 S 90745 331 278 S $ USES Operating Services: General Government Courts & Public Safety Health & Public Welfare Public Works Subtotal Debt Service: Principal Interest and Fees Capital Cash Payments Subtotal Total Uses 78,794 $ 48, 195$ 99,691 $ 86,829 $ 313.509 $ 74,3345 49,548 5 95.118 5 81,557 5 300.557 5 76,3575 49.8195 102.076 S 76,450 S 304,025 312.039 4,995 19,605 S 3,868 $ 28.4685 341,9775 8,285 S 11,815 S 2,3375 224175 23.663 6,489 s 18475 3,227 s 280163 S 322.994 $ 2655 Cash (Outflow) Inflow Beginning Fund Balance Ending Fund Balance (17.190) 288.6875 22 555 8.284 271497 279.7515 Source: Note: 19%-A General Obligation Official Statement *1995 figures unaudited Exhibit 2 Jefferson County Sewer-Backed Debt as of 1995-A Bond Issuance Warrants through September 30, 2025 The following table set forth the del service on the Senior Dalf and the Series 1995 add due to rounding) Series 1995-A Warrants Total Debt Service Total Debt Service on Senior Indenture SRF Warrant Total Senior Payable From ervice Warrants Debt Service System Revenues Fiscal Year Interest Principal 51.111.563 $11.793,078 $13,999,745 1995 $2,166,667 $8,689,515 $8,668,555 $12.807,443 $4,138,888 $6,500,000 $19,307,443 1996 $19.297,809 $12.797,809 54.136.229 $8,661,580 $6,500,000 1997 $19,305,519 $12,805,519 $6,500,000 1998 $8,670,088 5,135431 $8,658,868 $6,500,000 54.136,293 $19,295,161 $12.795,161 1999 $4,138,610 $8,668,908 $6,500,000 $19,307 518 $12,807,518 2000 $6,500,000 $8,662,948 2001 54.137.283 $12.800,231 $19,300 231 2002 58,665,313 $6,500,000 $19,302,522 $4,137,209 $12,802,522 $8.665,730 $6,500,000 2003 $12,803,916 $4.138, 186 $19,303,916 2004 56.500,000 $8,666,230 $4,135.114 $12.801.344 $19,301,344 2005 $6,500,000 55,805 270 54,137,789 $12.943,099 $19.463,099 2006 $6,500,000 58.661,383 $4.136,009 $12.797,392 $19.297 392 2007 $6,500,000 $8,671,583 $ ,139,571 $12,811,154 $19.311,154 2008 $6,500,000 58.666,350 3:54.138,274 $12.804,624 519 304,624 2009 $6,500,000 $8,773,650 $4,137.015 $12,910,665 $19.410.565 2010 $6.500.000 $8,779,900 54.135,593 $12.915.493 519,415.493 2011 $6,500,000 $8.777,600 $4,138,703 $12.916,303 519.416,303 2012 $6,500,000 58,775,400 54.136,143 $12.911,543 519.411,543 2013 56,500,000 58.776.800 54,137,710 $12.914.510 $19.414,510 2014 $8,775,000 = $6,500,000 $4,138,101 $4.138.101 519.413,101 2015 $8,775,000 56,061.250 $4,137,114 $4,137,114 518,973,364 2016 $11,245,000 $5,622,500 $16.567.500 $11,245,000 $5,060,250 2018 $16.305.250 511,245,000 54.498,000 $15.743.000 $11,245,000 $3,935,750 $15.180.750 2020 $11,245,000 $3,373,500 2021 $11,245,000 $14,618.500 $2,811,250 2022 $11,245,000 $14.656250 $2,249.000 2023 $11,245,000 $1.686750 $1494 2024 $123 51.124,500 2025 $11,245,000 $562 512369 50 TOTAL 5110 SC 5130,000,000 $162,651,667 $165,335,671 5251.214495 $53.866.162 2017 2019 In rest on the series 1995-A Warrants has been calculated based upon med rates. 1995-A Warrants will be variable, actual debt service may vary from this time Iecause the interest t o the end Source: Official Statement for Series 1995-A warrants Exhibit 1: Consolidated Balance Sheet of United Principal Life ($ in thousands) Cash, cash equivalents, and short-term securities 40,195 Fixed-income securities 224,820 U.S. Treasures 37,264 Corporate bonds 160,978 RMBS 27,362 CMBS 17,216 Equity securities 20,392 Mortgages secured by income-producing property 123,685 Policy loans 15,561 Other assets 9,158 Total assets 451,811 Insurance contract liabilities Other liabilities 400,382 19,350 Equity 32,079 451,811 Total liabilities and equity Note: As of December 31, 2009, Exhibit 2: Investment Policy Statement of United Principal Life (abridged) SECTION III: BOND INVESTING Our strategy is to create a Fixed Income Investment Program to achieve the following three objectives: (a) To reduce the risk of the overall investment portfolio because bonds have lower risk than other major asset classes, (b) to eam an annualized net (after fees and expenses) rate of return that exceeds the Barclays Capital U.S. Universal Bond Index over rolling five- to seven-year periods by 10-20 basis points, with expected tracking error of 0.5 percent to 1 percent, (c) to serve as a source of liquidity for making claims payments and for rebalancing purposes. Investments in the FIIP may include all sectors of the fixed-income market included in the Barclays Capital U.S. Aggregate Bond Index-a broad measure of the U.S. dollar-denominated, investment-grade, taxable bond market. Also permitted are other investment-grade sectors such as municipal bonds, collateralized mortgage obligations (CMOs) such as RMBS and CMBS, and Rule 144A securities. FIIP investments are to be diversified so that no more than 15 percent is invested in one industry (does not apply to U.S. government securities). No more than a maximum of 5 percent of the FIIP may be invested in securities of any one corporation Securities issued under Rule 144A (nonregistered debt) are limited to 20 percent of the market value of the FIIP portfolio. Private placement securities are limited to 5 percent of the market value of the portfolio. SECTION VI: DIRECT MORTGAGE INVESTING Our strategy is to create a Mortgage Investment Program to generate a diversified portfolio of high-quality mortgage investments secured by income-producing property. The returns on these investments are expected to compare favorably to those of alternative fixed-income investments. The MIP shall have a "core" risk/retum orientation and, therefore, the program will target loan investments that (1) have creditworthy borrowers and (2) mortgages secured by real property. The primary strategy of the MIP is to make loan originations that are underwritten using the standard loan due diligence process so risks are identified, evaluated, and priced accordingly. Risks may include borrower credit, tenancy, lease-up, rollover, location, property type, market, submarket, and transaction structure. Term, amortization, and rollover risk will be structured to maximize the probability of exit at loan maturity. Additionally, mortgage loans should be structured in an effort to provide limited principal risk and significant call protection. In particular, mortgage loans will be locked to prepayment for a portion of the term then open to prepayment with the payment of a fee, the greater of 1 percent of the loan balance or UST based yield maintenance at like-term UST rates plus 50 basis points. Preservation of capital is an important objective of the Funds' Mortgage Participation Program. As such, high-quality, fixed-rate loans generally are preferred. No participating loans, mezzanine debt, or second mortgage loans are permitted under this policy. Moderate leasing risk is acceptable. Substantial preleasing will be required on forward commitment loans. Loans on operating properties generally require higher, stabilized levels of occupancy of at least 85 percent. Exhibit 2 (continued) MIP investments should provide reasonable diversification by geographic location. MIP investments are subject to a minimum debt service coverage ratio of 1.25:1.0, a maximum LTV of 70 percent based on the underwritten valuation, and supported by a satisfactory appraisal prepared by an approved MAI Loan coupon rates, generally speaking, should generate spreads of 200-400 basis points over common-maturity UST. Given current conditions, spreads are expected to approach the upper boundary of the range. Mortgage loans will be nonrecourse, except for standard carve-out provisions, such as fraud, misrepresentation, misapplication of funds, and environmental issues, guaranteed by acceptable credits. All lending will be subject to an independent appraisal as well as engineering and environmental reviews


 these are the correct exhibits


