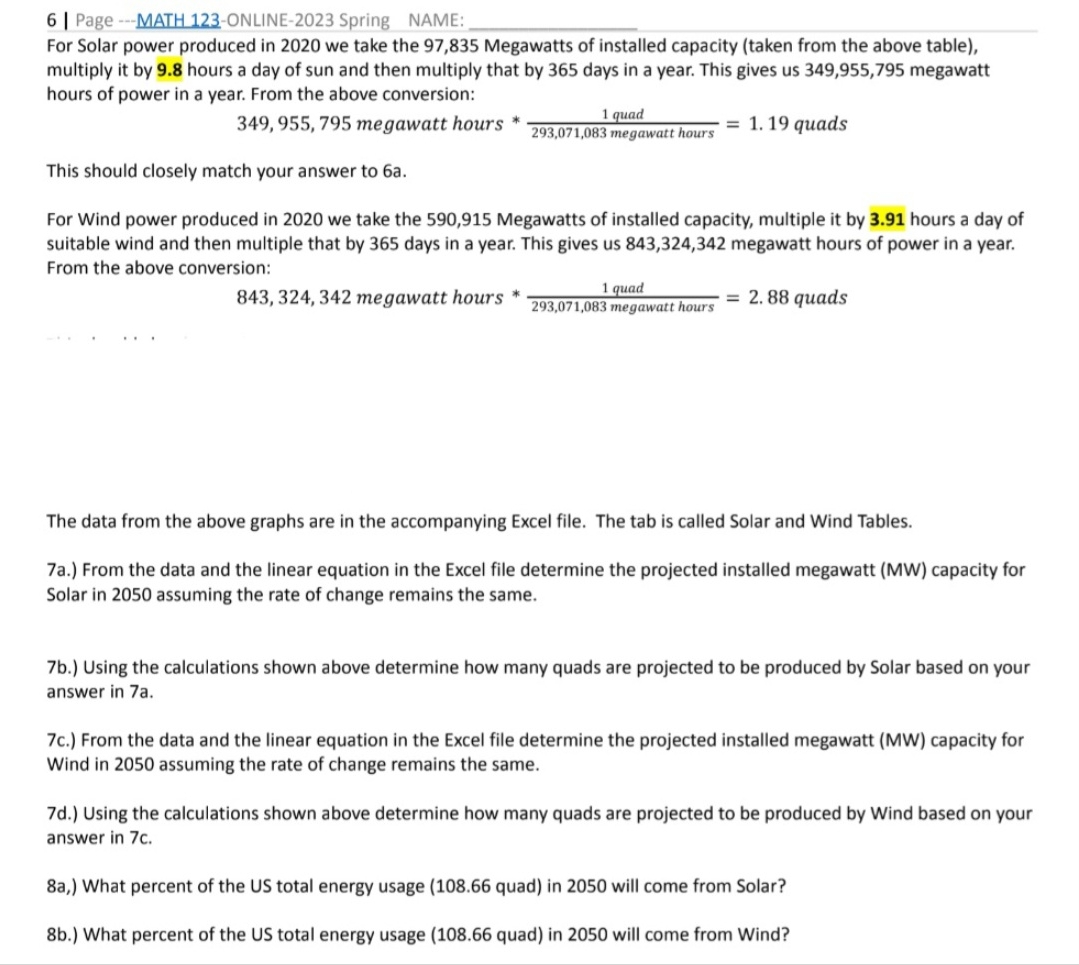
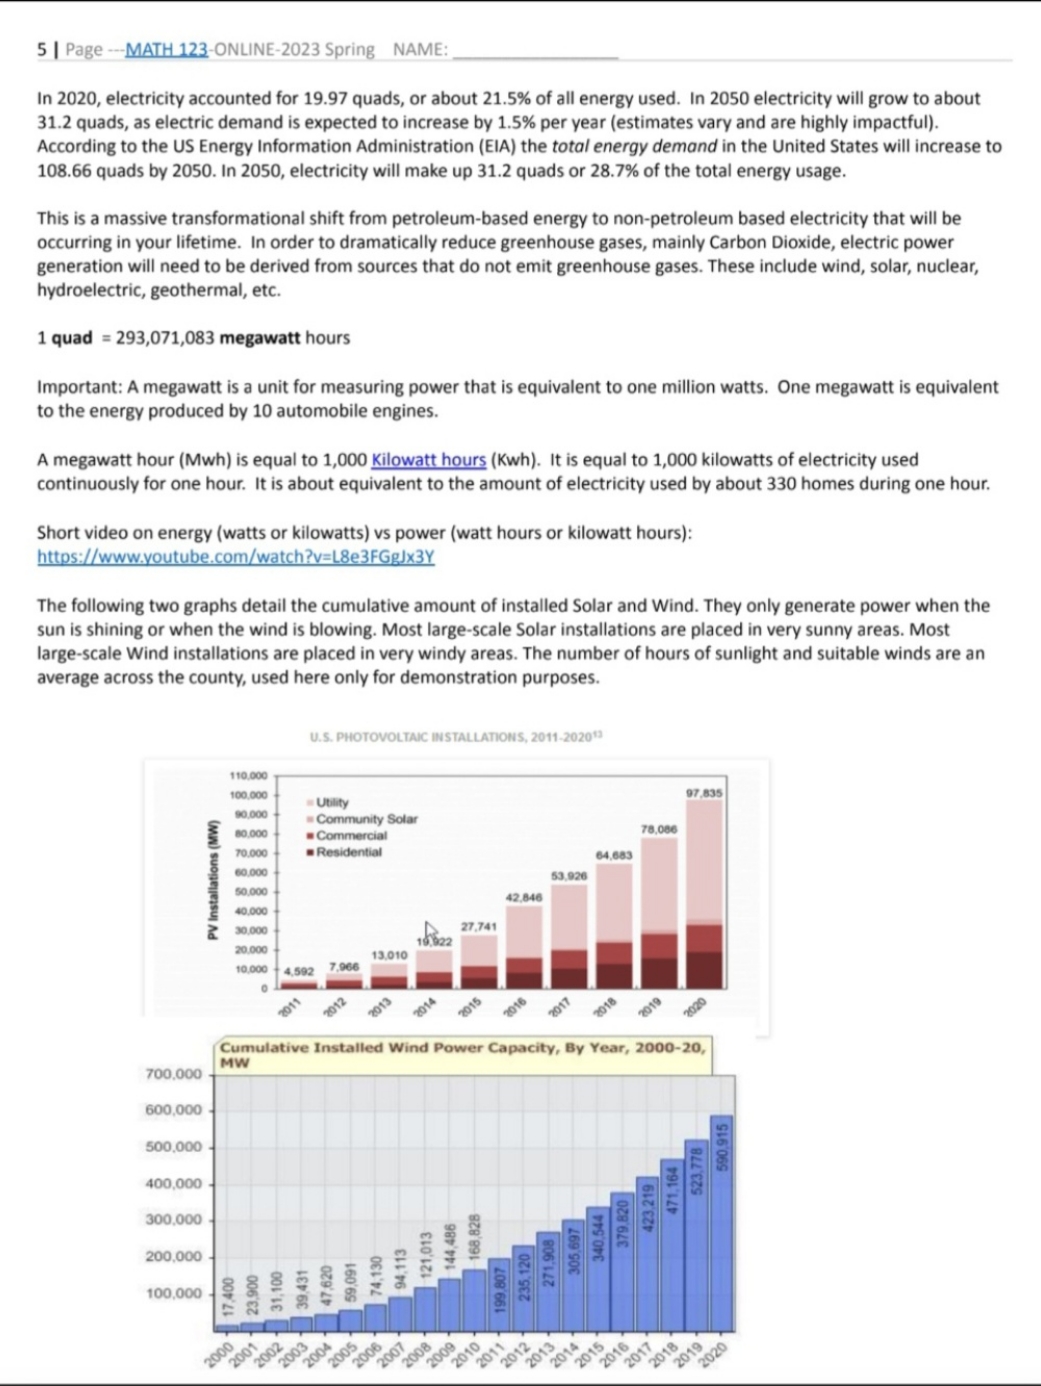
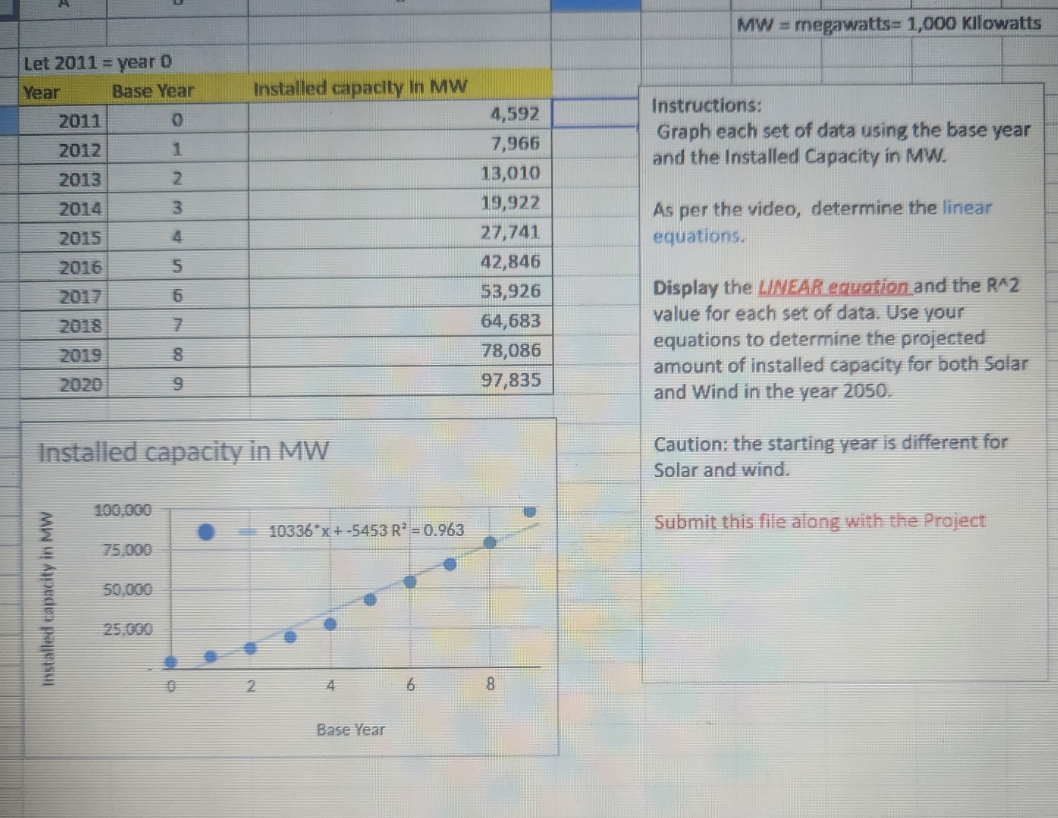
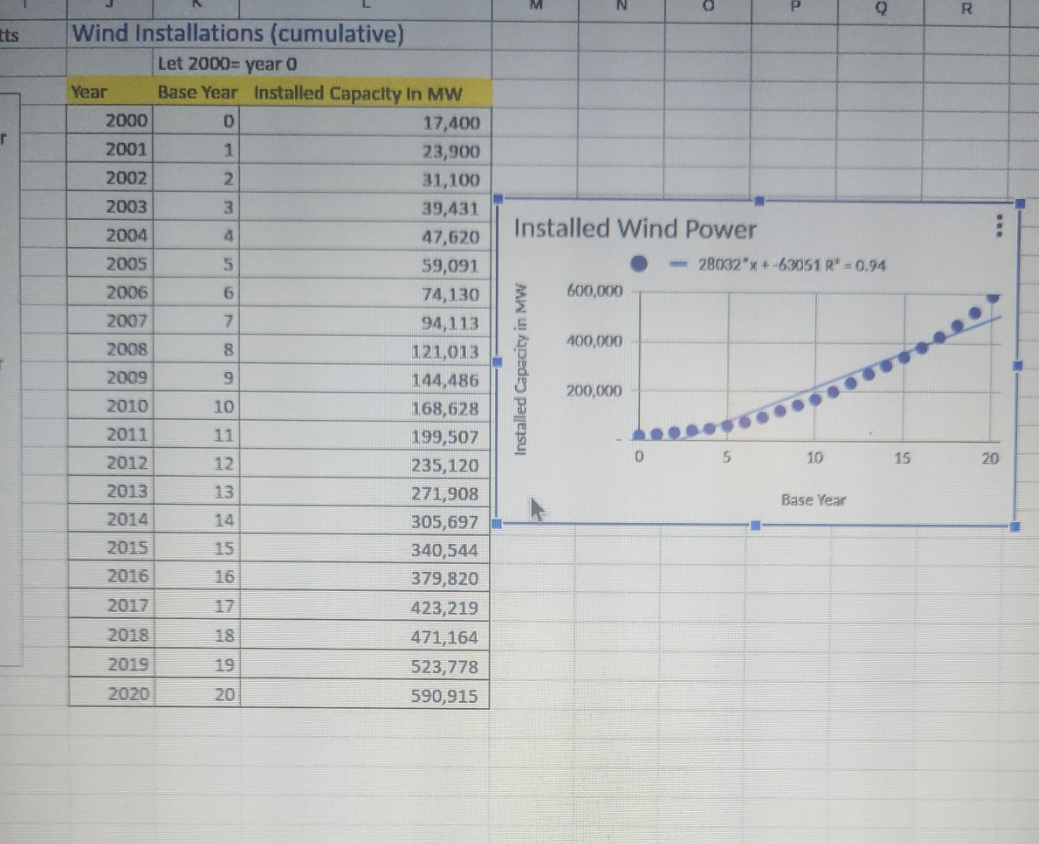
These are the linear equation and r^2 values for the questions1) Installed capacity in MW: 10336*x+-5453 R=0.9632) Installed Wind power: 28032*x+-63051 R=0.94
6 | Page ---MATH 123-ONLINE-2023 Spring NAME: For Solar power produced in 2020 we take the 97,835 Megawatts of installed capacity (taken from the above table), multiply it by 9.8 hours a day of sun and then multiply that by 365 days in a year. This gives us 349,955,795 megawatt hours of power in a year. From the above conversion: 349,955, 795 megawatt hours * L guad 293,071,083 megawatt hours =119 quads This should closely match your answer to 6a. For Wind power produced in 2020 we take the 590,915 Megawatts of installed capacity, multiple it by 3.91 hours a day of suitable wind and then multiple that by 365 days in a year. This gives us 843,324,342 megawatt hours of power in a year. From the above conversion: 843, 324, 342 megawatt hours * jquad 793,071,083 megawart hours' 2+ 88 quads The data from the above graphs are in the accompanying Excel file. The tab is called Solar and Wind Tables. 7a.) From the data and the linear equation in the Excel file determine the projected installed megawatt (MW) capacity for Solar in 2050 assuming the rate of change remains the same. 7b.) Using the calculations shown above determine how many quads are projected to be produced by Solar based on your answer in 7a. 7c.) From the data and the linear equation in the Excel file determine the projected installed megawatt (MW) capacity for Wind in 2050 assuming the rate of change remains the same. 7d.) Using the calculations shown above determine how many quads are projected to be produced by Wind based on your answer in 7c. 8a,) What percent of the US total energy usage (108.66 quad) in 2050 will come from Solar? 8b.) What percent of the US total energy usage (108.66 quad) in 2050 will come from Wind? S5 | Page --MATH 123-ONLINE-2023 Spring NAME: __ In 2020, electricity accounted for 19.97 quads, or about 21.5% of all energy used. In 2050 electricity will grow to about 31.2 quads, as electric demand is expected to increase by 1.5% per year (estimates vary and are highly impactful). According to the US Energy Information Administration (EIA) the total energy demand in the United States will increase to 108.66 quads by 2050. In 2050, electricity will make up 31.2 quads or 28.7% of the total energy usage. This is a massive transformational shift from petroleum-based energy to non-petroleum based electricity that will be occurring in your lifetime. In order to dramatically reduce greenhouse gases, mainly Carbon Dioxide, electric power generation will need to be derived from sources that do not emit greenhouse gases. These include wind, solar, nuclear, hydroelectric, geothermal, etc. 1quad = 293,071,083 megawatt hours Important: A megawatt is a unit for measuring power that is equivalent to one million watts. One megawatt is equivalent to the energy produced by 10 automobile engines. A megawatt hour (Mwh) is equal to 1,000 Kilowatt hours (Kwh). It is equal to 1,000 kilowatts of electricity used continuously for one hour. It is about equivalent to the amount of electricity used by about 330 homes during one hour. Short video on energy (watts or kilowatts) vs power (watt hours or kilowatt hours): h J/WwWw. .com, h?v= FGpix3Y The following two graphs detail the cumulative amount of installed Solar and Wind. They only generate power when the sun Is shining or when the wind is blowing. Most large-scale Solar installations are placed in very sunny areas. Most large-scale Wind installations are placed in very windy areas. The number of hours of sunlight and suitable winds are an average across the county, used here only for demonstration purposes. 110 000 100 000 PV installations (MW) BB 2 g88 &S & & PSSP | Cumulative Installed Wind Power Capacity, By Year, 2000- 20, 700,000 4y 600,000 500.000 400,000 300.000 200,000 100 000 - Y A P S LTI S F S P S IE F S S S MW = megawatts= 1,000 Kilowatts Let 2011 = year 0 Year Base Year Installed capacity in MW 2011 O 4,592 Instructions: 2012 1 7,966 Graph each set of data using the base year 2013 2 13,010 and the Installed Capacity in MW. 2014 19,922 As per the video, determine the linear 2015 27,741 equations. 2016 42,846 2017 6 53,926 Display the LINEAR equation and the R^2 2018 64,683 value for each set of data. Use your 2019 78,086 equations to determine the projected 2020 9 97,835 amount of installed capacity for both Solar and Wind in the year 2050. Installed capacity in MW Caution: the starting year is different for Solar and wind. 100,000 10336*x+ -5453 R' -0.963 Submit this file along with the Project 75.000 50,000 Installed capacity in MW 25.000 0 2 4 6 8 Base YearQ R its Wind Installations (cumulative) Let 2000= year 0 Year Base Year Installed Capacity In MW 2000 17,400 2001 23,900 2002 31,100 2003 39,431 ... 2004 47,620 Installed Wind Power 2005 5 59,091 - 28032"x + -63051 R' = 0.94 2006 6 74,130 600,000 2007 94, 113 2008 8 121,013 400,000 Installed Capacity in MW 2009 144,486 200.000 2010 10 168,628 2011 11 199,507 2012 0 12 235,120 5 10 15 20 2013 13 271,908 Base Year 2014 14 305,697 2015 15 340,544 2016 16 379,820 2017 17 423,219 2018 18 471,164 2019 19 523,778 2020 20 590,915


