Answered step by step
Verified Expert Solution
Question
1 Approved Answer
These are the numbers I got! 6.2 -13.7 -14.5 -5.3 7.2 -10.1 13.8 1.2 1.1 3.5 3.2 -13.3 -3.9 -4.5 13.6 2.9 -13.7 -9.5 -11.5
These are the numbers I got!
6.2 -13.7 -14.5 -5.3 7.2 -10.1 13.8 1.2 1.1 3.5 3.2 -13.3 -3.9 -4.5 13.6 2.9 -13.7 -9.5 -11.5 11.7 15.4 2.3 -10.1 7.4 4.6 -3.6 6.3 4.2 -10.1 -5.7 2.1 -7.9 14.2 7.5 13.5 12.2 6.5 2.3 4.1 4.3
I just need help with C
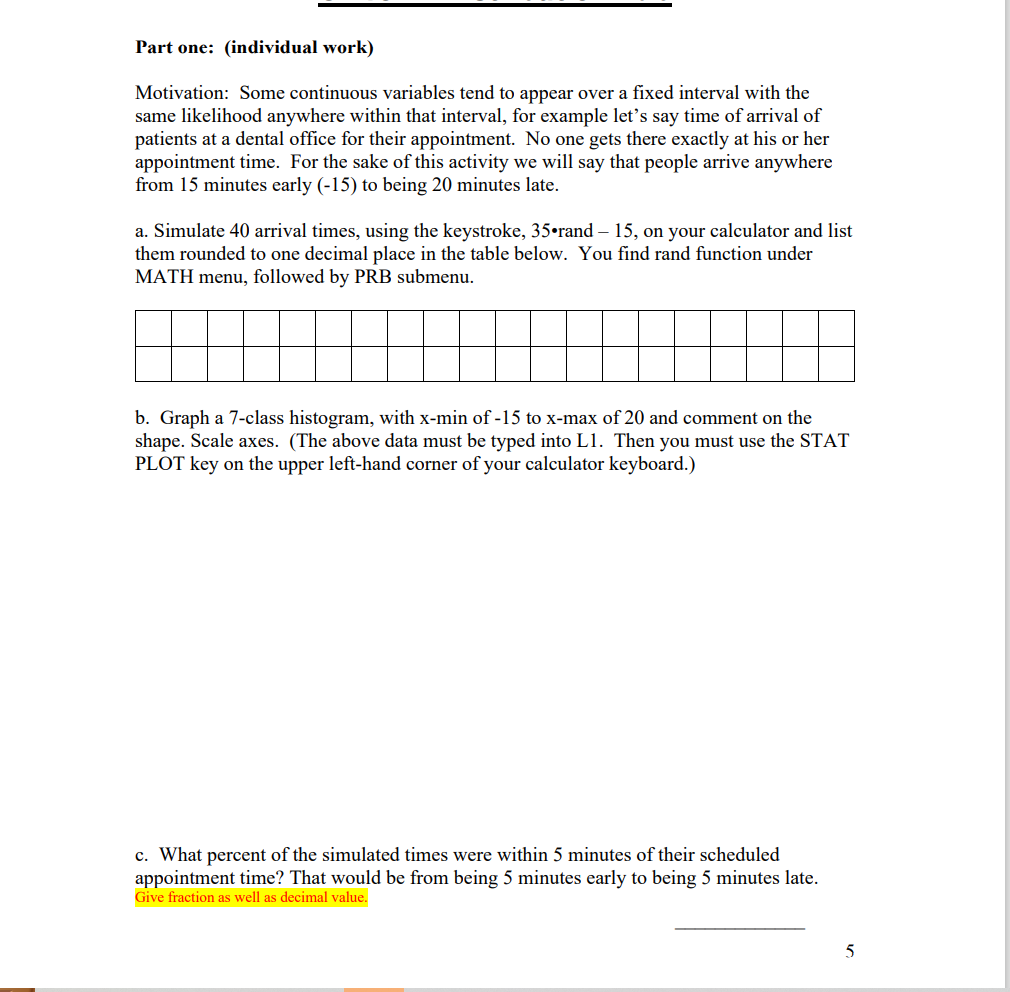
Part one: (individual work) Motivation: Some continuous variables tend to appear over a fixed interval with the same likelihood anywhere within that interval, for example let's say time of arrival of patients at a dental office for their appointment. No one gets there exactly at his or her appointment time. For the sake of this activity we will say that people arrive anywhere from 15 minutes early (15) to being 20 minutes late. a. Simulate 40 arrival times, using the keystroke, 35rand15, on your calculator and list them rounded to one decimal place in the table below. You find rand function under MATH menu, followed by PRB submenu. b. Graph a 7-class histogram, with x-min of 15 to x-max of 20 and comment on the shape. Scale axes. (The above data must be typed into L1. Then you must use the STAT PLOT key on the upper left-hand corner of your calculator keyboard.) c. What percent of the simulated times were within 5 minutes of their scheduled appointment time? That would be from being 5 minutes early to being 5 minutes late. Give fraction as well as decimal value. Part one: (individual work) Motivation: Some continuous variables tend to appear over a fixed interval with the same likelihood anywhere within that interval, for example let's say time of arrival of patients at a dental office for their appointment. No one gets there exactly at his or her appointment time. For the sake of this activity we will say that people arrive anywhere from 15 minutes early (15) to being 20 minutes late. a. Simulate 40 arrival times, using the keystroke, 35rand15, on your calculator and list them rounded to one decimal place in the table below. You find rand function under MATH menu, followed by PRB submenu. b. Graph a 7-class histogram, with x-min of 15 to x-max of 20 and comment on the shape. Scale axes. (The above data must be typed into L1. Then you must use the STAT PLOT key on the upper left-hand corner of your calculator keyboard.) c. What percent of the simulated times were within 5 minutes of their scheduled appointment time? That would be from being 5 minutes early to being 5 minutes late. Give fraction as well as decimal valueStep by Step Solution
There are 3 Steps involved in it
Step: 1
Get Instant Access to Expert-Tailored Solutions
See step-by-step solutions with expert insights and AI powered tools for academic success
Step: 2
Step: 3
Ace Your Homework with AI
Get the answers you need in no time with our AI-driven, step-by-step assistance
Get Started