these are two questions, three picture is first question and last two pictures are second question
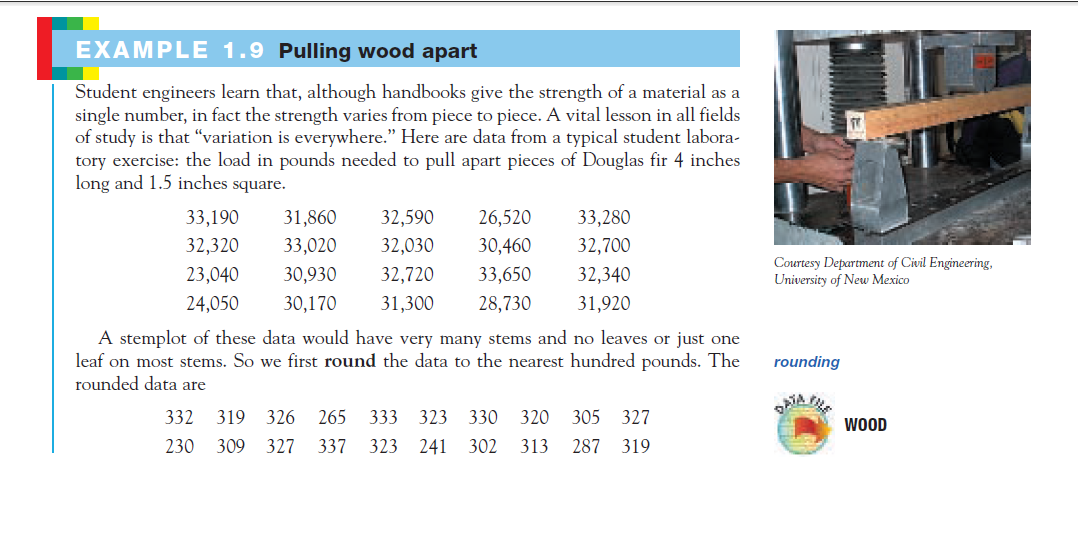
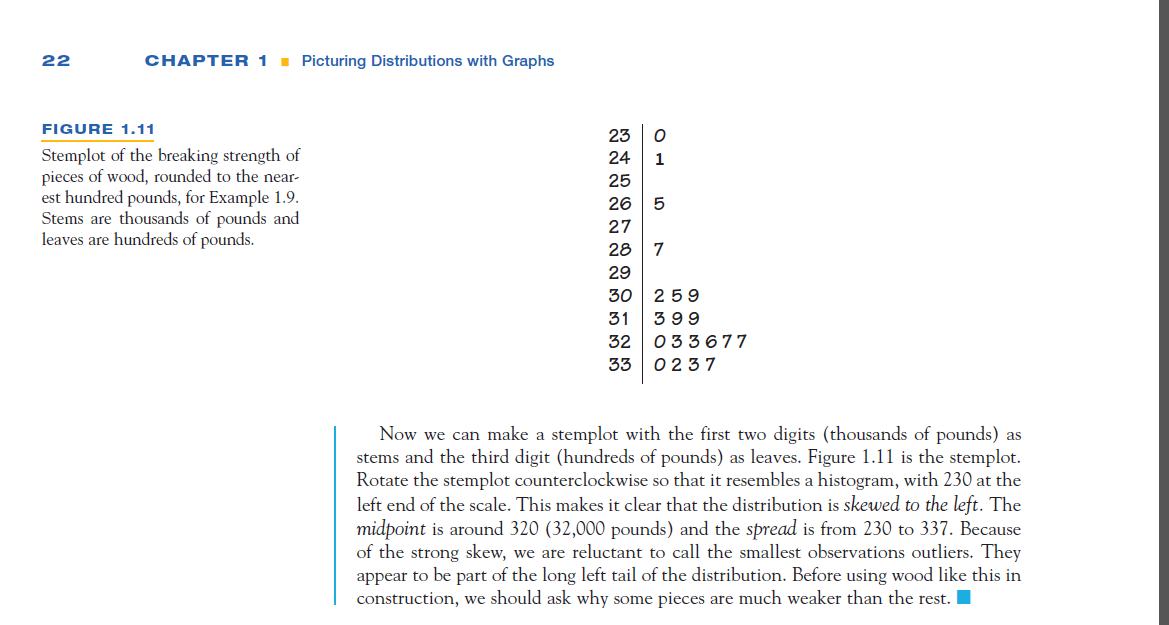
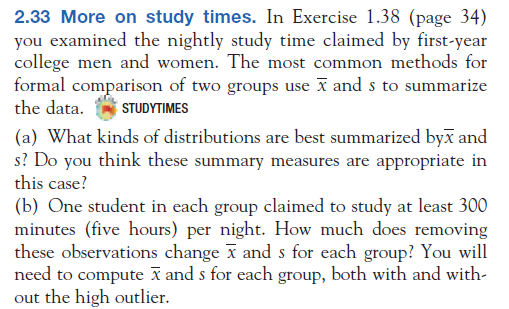
2.23 Pulling wood apart. Example 1.9 {page Ii} gives the breaking strengths of 20 pieces of Douglas fir+ WEED {a} lGive the fivevnurnber SUIIIIIIEIIZY of the distribution of breaking strengths. {The sternpiot, Figure Li 1, helps because it arranges the data in order, but you should use the uru'ounded values in numerical work} {b} The steInpiot shows that the distribution is skewed to the left Does the fivevnurnber surnrnarv show the sisce'wir Remerrv bEl' that onlj.r a graph gives a clear picture of the shape of a distribution. EXAMPLE 1 .9 Student engineers learn that, although handbooks give the strength of a material as a single number, in fact the strength varies from piece to piece. A vital lesson in all fields of study is that \"variation is everywhere." Here are data From a typical student labora tory exercise: the load in pounds needed to pull apart pieces of Douglas fit 4 inches long and 1.5 inches square. 33,190 31,860 32,590 26,520 33,280 32,320 33,020 32,030 30,460 32,700 23,040 30,930 32,220 33,650 32,340 mjm'wm 24,050 30,1?0 31,300 28,?30 31,920 A stemplot of these data would have very many stems and no leaves or just one leaf on most stems. So we first round the data to the nearest hundred pounds. The rounding rounded data are 332 319 326 265 333 323 330 320 305 327 i WOOD 230 309 327 337 323 241 302 313 287 319 22 CHAPTER 1 I Picturing Distributions with Graphs FIGURE 1.11 Sternplot of the breaking strength of pieces ofwood, rounded to the near est hundred pounds, for Example 1.9. Stems are thousands of pounds and leaves are hundreds of pounds. 25 24 25 26 27 26 29 5O 51 52 55 7 259 599 055677 0257 Now we can make a sternplot with the first two digits (thousands of pounds) as stems and the third digit {hundreds of pounds} as leaves. Figure 1.11 is the stemplot. Rotate the steInplot counterclockwise so that it resembles a histogram, with 230 at the left end of the scale. This makes it clear that the distribution is skewed to the left. The nu'dpoint is around 320 (32,000 pounds} and the spread is from 230 to 337. Because of the strong skew, we are reluctant to call the smallest observations outliers. They appear to be part of the long left tail of the distribution. Before using wood like this in construction, we should ask why some pieces are much weaker than the rest. I 2.33 More on study times. In Exercise 1.38 [page 34} you examined the nightly study? time eiaimed by fil'Ste'ffil' eoilege men and women. The most common methods for formal eorn arison of two groups use E and 5 to summarise the data. ,,_ smnrnnlss {a} 11What kinds of distributions are best summarised byE and 33' Do you think these summarj.r measures are appropriate in this ease? {in} ICine student in eaeh group claimed to stud}.r at least 3013 minutes [five hours}I per night. How mueh does removing these observations ehange E and 5 for eaeh group? You will need to eompute E and s for eaeh groupII both with and with out the high outlier+ Make a stemplot to display the distribution of pups born per year. {Round to the nearest whole number and split the stems.)I Describe the shape, center, and spread of the distribu tion. Are there any outliers? Han-y Wallcerfpilomiibfmy 1.38 Do women study more than men? We asked the stu dents in a large first-year college class how many minutes they studied on a typical weeknight. Here are the responses of random samples of 30 women and 30 men from the class: Q STUDYTIHES (a) Examine the data. Why are you not surprised that most responses are multiples of 10 minutes? What is the other com mon multiple found in the data? We eliminated one student who claimed to study 10,000 minutes per night. Are there any other responses you consider suspicious? (b) Make a backto-back stemplot to compare the two samples. That is, use one set of stems with two sets of leaves. one to the right and one to the left of the stems. (Draw a line on either side of the stems to separate stems and leaves.) Order both sets of leaves from smallest at the stem to largest away from the stem. Report the approxi- mate midpoints of both groups. Does it appear that women study more than men (or at least claim that they do}? badr-fo-badr area-raptor W0 I118" I Man 270 150 180 360 180 120 120 30 45 200 120 180 120 240 170' 90 90 30 120 T5 150 120 180' 180 150:150 90 60 240 300 200 150 180 120 240 240 60 150 60 3O 120 60 120 180 180: 30 230 120 95 150 90 240 180 115 120 0 200 120 120 180 1.39 Fur seals on St. George Island. Make a time plot of the number of fur seals born per year from Exercise 1.37. What does the time plot show that your stemplot in Exercise 1.37 did not show? When you have data collected over time, a time plot is often needed to understand what is happening. WES-EMS