

Question
These charts represents the revenue by geographic segments of Apple Inc. over the length of 10 years. Do an analysis/interpretation of what is happening in
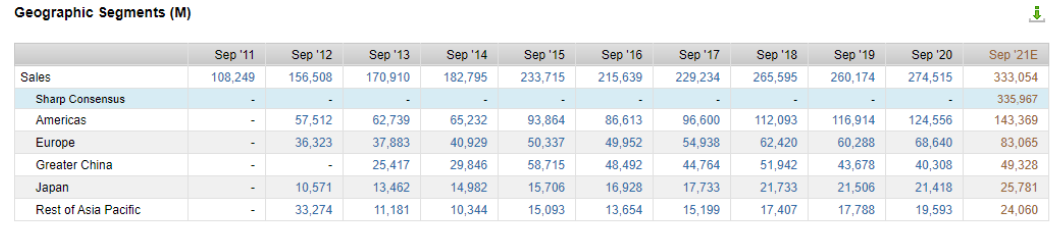
These charts represents the revenue by geographic segments of Apple Inc. over the length of 10 years. Do an analysis/interpretation of what is happening in the charts. Also identify any significant changes in the charts through the years..
Step by Step Solution
There are 3 Steps involved in it
Step: 1

Get Instant Access to Expert-Tailored Solutions
See step-by-step solutions with expert insights and AI powered tools for academic success
Step: 2

Step: 3
Ace Your Homework with AI
Get the answers you need in no time with our AI-driven, step-by-step assistance
Get Started
Proli Footwear Inc An Audit And Fraud Simulation For Team Based Student Learning
Authors: Prof Richard J. Proctor CPA, Prof Patricia M. Poli Phd
2nd Edition
0615455492, 978-0615455495