Answered step by step
Verified Expert Solution
Question
1 Approved Answer
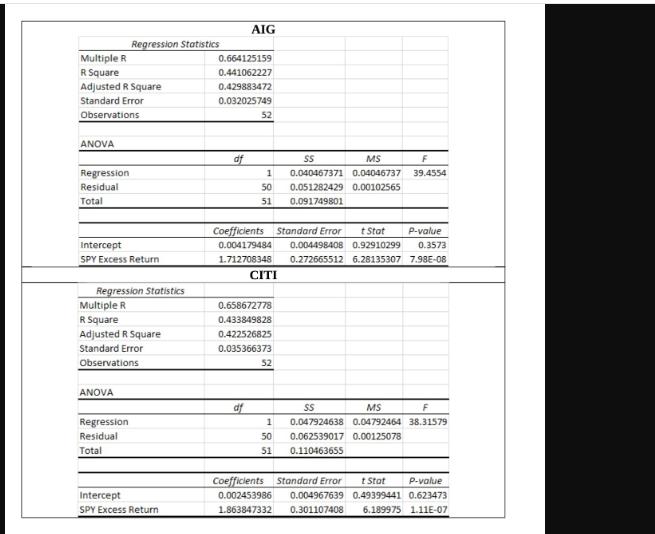
these regressions were run in Excel using the return on the SPY as a measure of the S&P500 return in 2012 (you can replicate


these regressions were run in Excel using the return on the SPY as a measure of the S&P500 return in 2012 (you can replicate the results using the regression feature in Excel if you want, but you don't have to). The table below is setup to contain all of the information you need in order to calculate the index model. Fill-in the table using the data from the regression. Multiple R R Square Adjusted R Square Standard Error Observations ANOVA Regression Residual Total Intercept SPY Excess Return Regression Statistics Regression Statistics Multiple R R Square Adjusted R Square Standard Error Observations ANOVA Regression Residual Total Intercept SPY Excess Return 0.664125159 0.441062227 0.429883472 0.032025749 df AIG 52 df SS MS 0.040467371 0.04046737 1 50 0.051282429 0.00102565 51 0.091749801 Coefficien Standard t Stat P-value 0.004179484 0.004498408 0.92910299 0.3573 1.712708348 0.272665512 6.28135307 7.98E-08 CITI 0.658672778 0.433849828 0.422526825 0.035366373 52 F 39.4554 1 50 51 SS MS F 0.047924638 0.04792464 38.31579 0.062539017 0.00125078 0.110463655 Coefficients Standard Error t Stat P-value 0.002453986 0.004967639 0.49399441 0.623473 0.301107408 6.189975 1.11E-07 1.863847332
Step by Step Solution
★★★★★
3.45 Rating (161 Votes )
There are 3 Steps involved in it
Step: 1
Completed Index Model Table Stock Beta SPY Excess Return Alpha RSquared AIG 17127 00042 04411 CITI 1...
Get Instant Access to Expert-Tailored Solutions
See step-by-step solutions with expert insights and AI powered tools for academic success
Step: 2

Step: 3

Ace Your Homework with AI
Get the answers you need in no time with our AI-driven, step-by-step assistance
Get Started


