Answered step by step
Verified Expert Solution
Question
1 Approved Answer
This assessment is primarily on applied portfolio diversification using real data sets from stock markets. You are required to download the last three to five

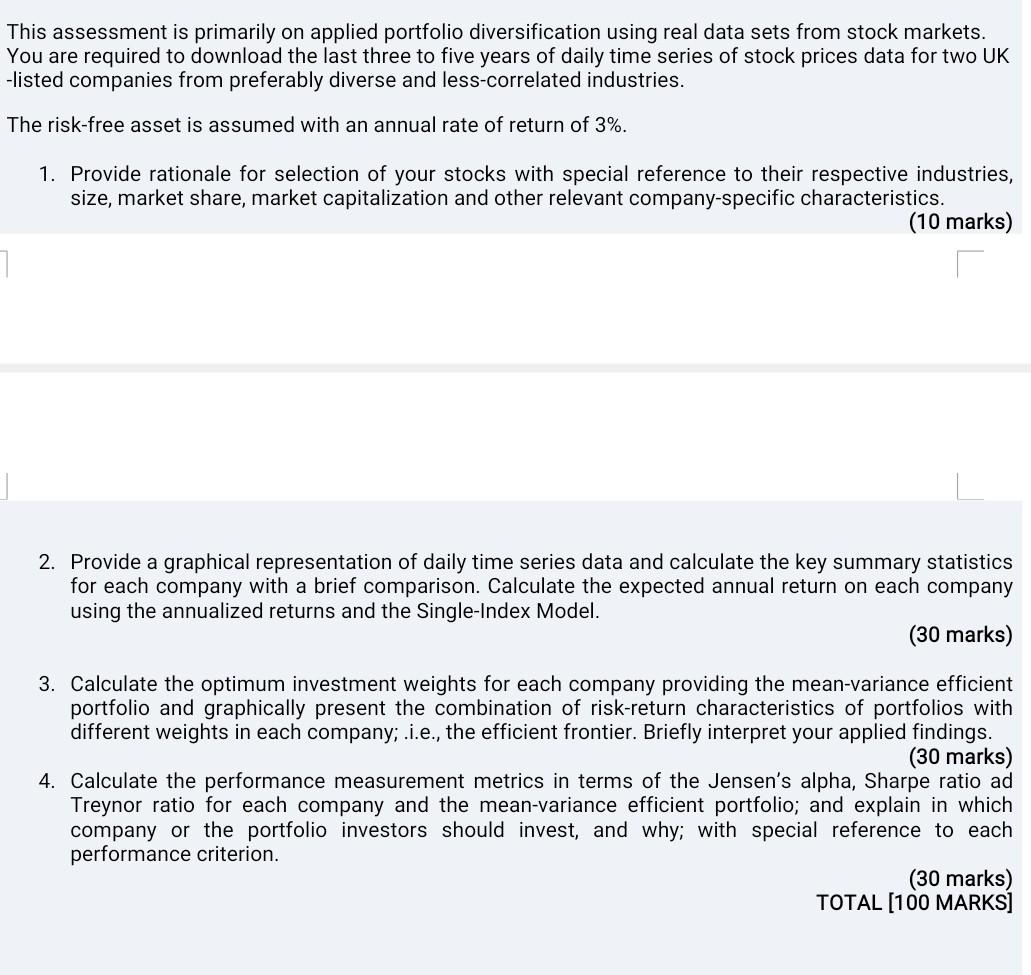
This assessment is primarily on applied portfolio diversification using real data sets from stock markets. You are required to download the last three to five years of daily time series of stock prices data for two UK -listed companies from preferably diverse and less-correlated industries. The risk-free asset is assumed with an annual rate of return of 3%. 1. Provide rationale for selection of your stocks with special reference to their respective industries, size, market share, market capitalization and other relevant company-specific characteristics. (10 marks) 2. Provide a graphical representation of daily time series data and calculate the key summary statistics for each company with a brief comparison. Calculate the expected annual return on each company using the annualized returns and the Single-Index Model. (30 marks) 3. Calculate the optimum investment weights for each company providing the mean-variance efficient portfolio and graphically present the combination of risk-return characteristics of portfolios with different weights in each company; .i.e., the efficient frontier. Briefly interpret your applied findings. (30 marks) 4. Calculate the performance measurement metrics in terms of the Jensen's alpha, Sharpe ratio ad Treynor ratio for each company and the mean-variance efficient portfolio; and explain in which company or the portfolio investors should invest, and why; with special reference to each performance criterion. (30 marks) TOTAL [100 MARKS] This assessment is primarily on applied portfolio diversification using real data sets from stock markets. You are required to download the last three to five years of daily time series of stock prices data for two UK -listed companies from preferably diverse and less-correlated industries. The risk-free asset is assumed with an annual rate of return of 3%. 1. Provide rationale for selection of your stocks with special reference to their respective industries, size, market share, market capitalization and other relevant company-specific characteristics. (10 marks) 2. Provide a graphical representation of daily time series data and calculate the key summary statistics for each company with a brief comparison. Calculate the expected annual return on each company using the annualized returns and the Single-Index Model. (30 marks) 3. Calculate the optimum investment weights for each company providing the mean-variance efficient portfolio and graphically present the combination of risk-return characteristics of portfolios with different weights in each company; .i.e., the efficient frontier. Briefly interpret your applied findings. (30 marks) 4. Calculate the performance measurement metrics in terms of the Jensen's alpha, Sharpe ratio ad Treynor ratio for each company and the mean-variance efficient portfolio; and explain in which company or the portfolio investors should invest, and why; with special reference to each performance criterion. (30 marks) TOTAL [100 MARKS]
Step by Step Solution
There are 3 Steps involved in it
Step: 1

Get Instant Access to Expert-Tailored Solutions
See step-by-step solutions with expert insights and AI powered tools for academic success
Step: 2

Step: 3

Ace Your Homework with AI
Get the answers you need in no time with our AI-driven, step-by-step assistance
Get Started


