Answered step by step
Verified Expert Solution
Question
1 Approved Answer
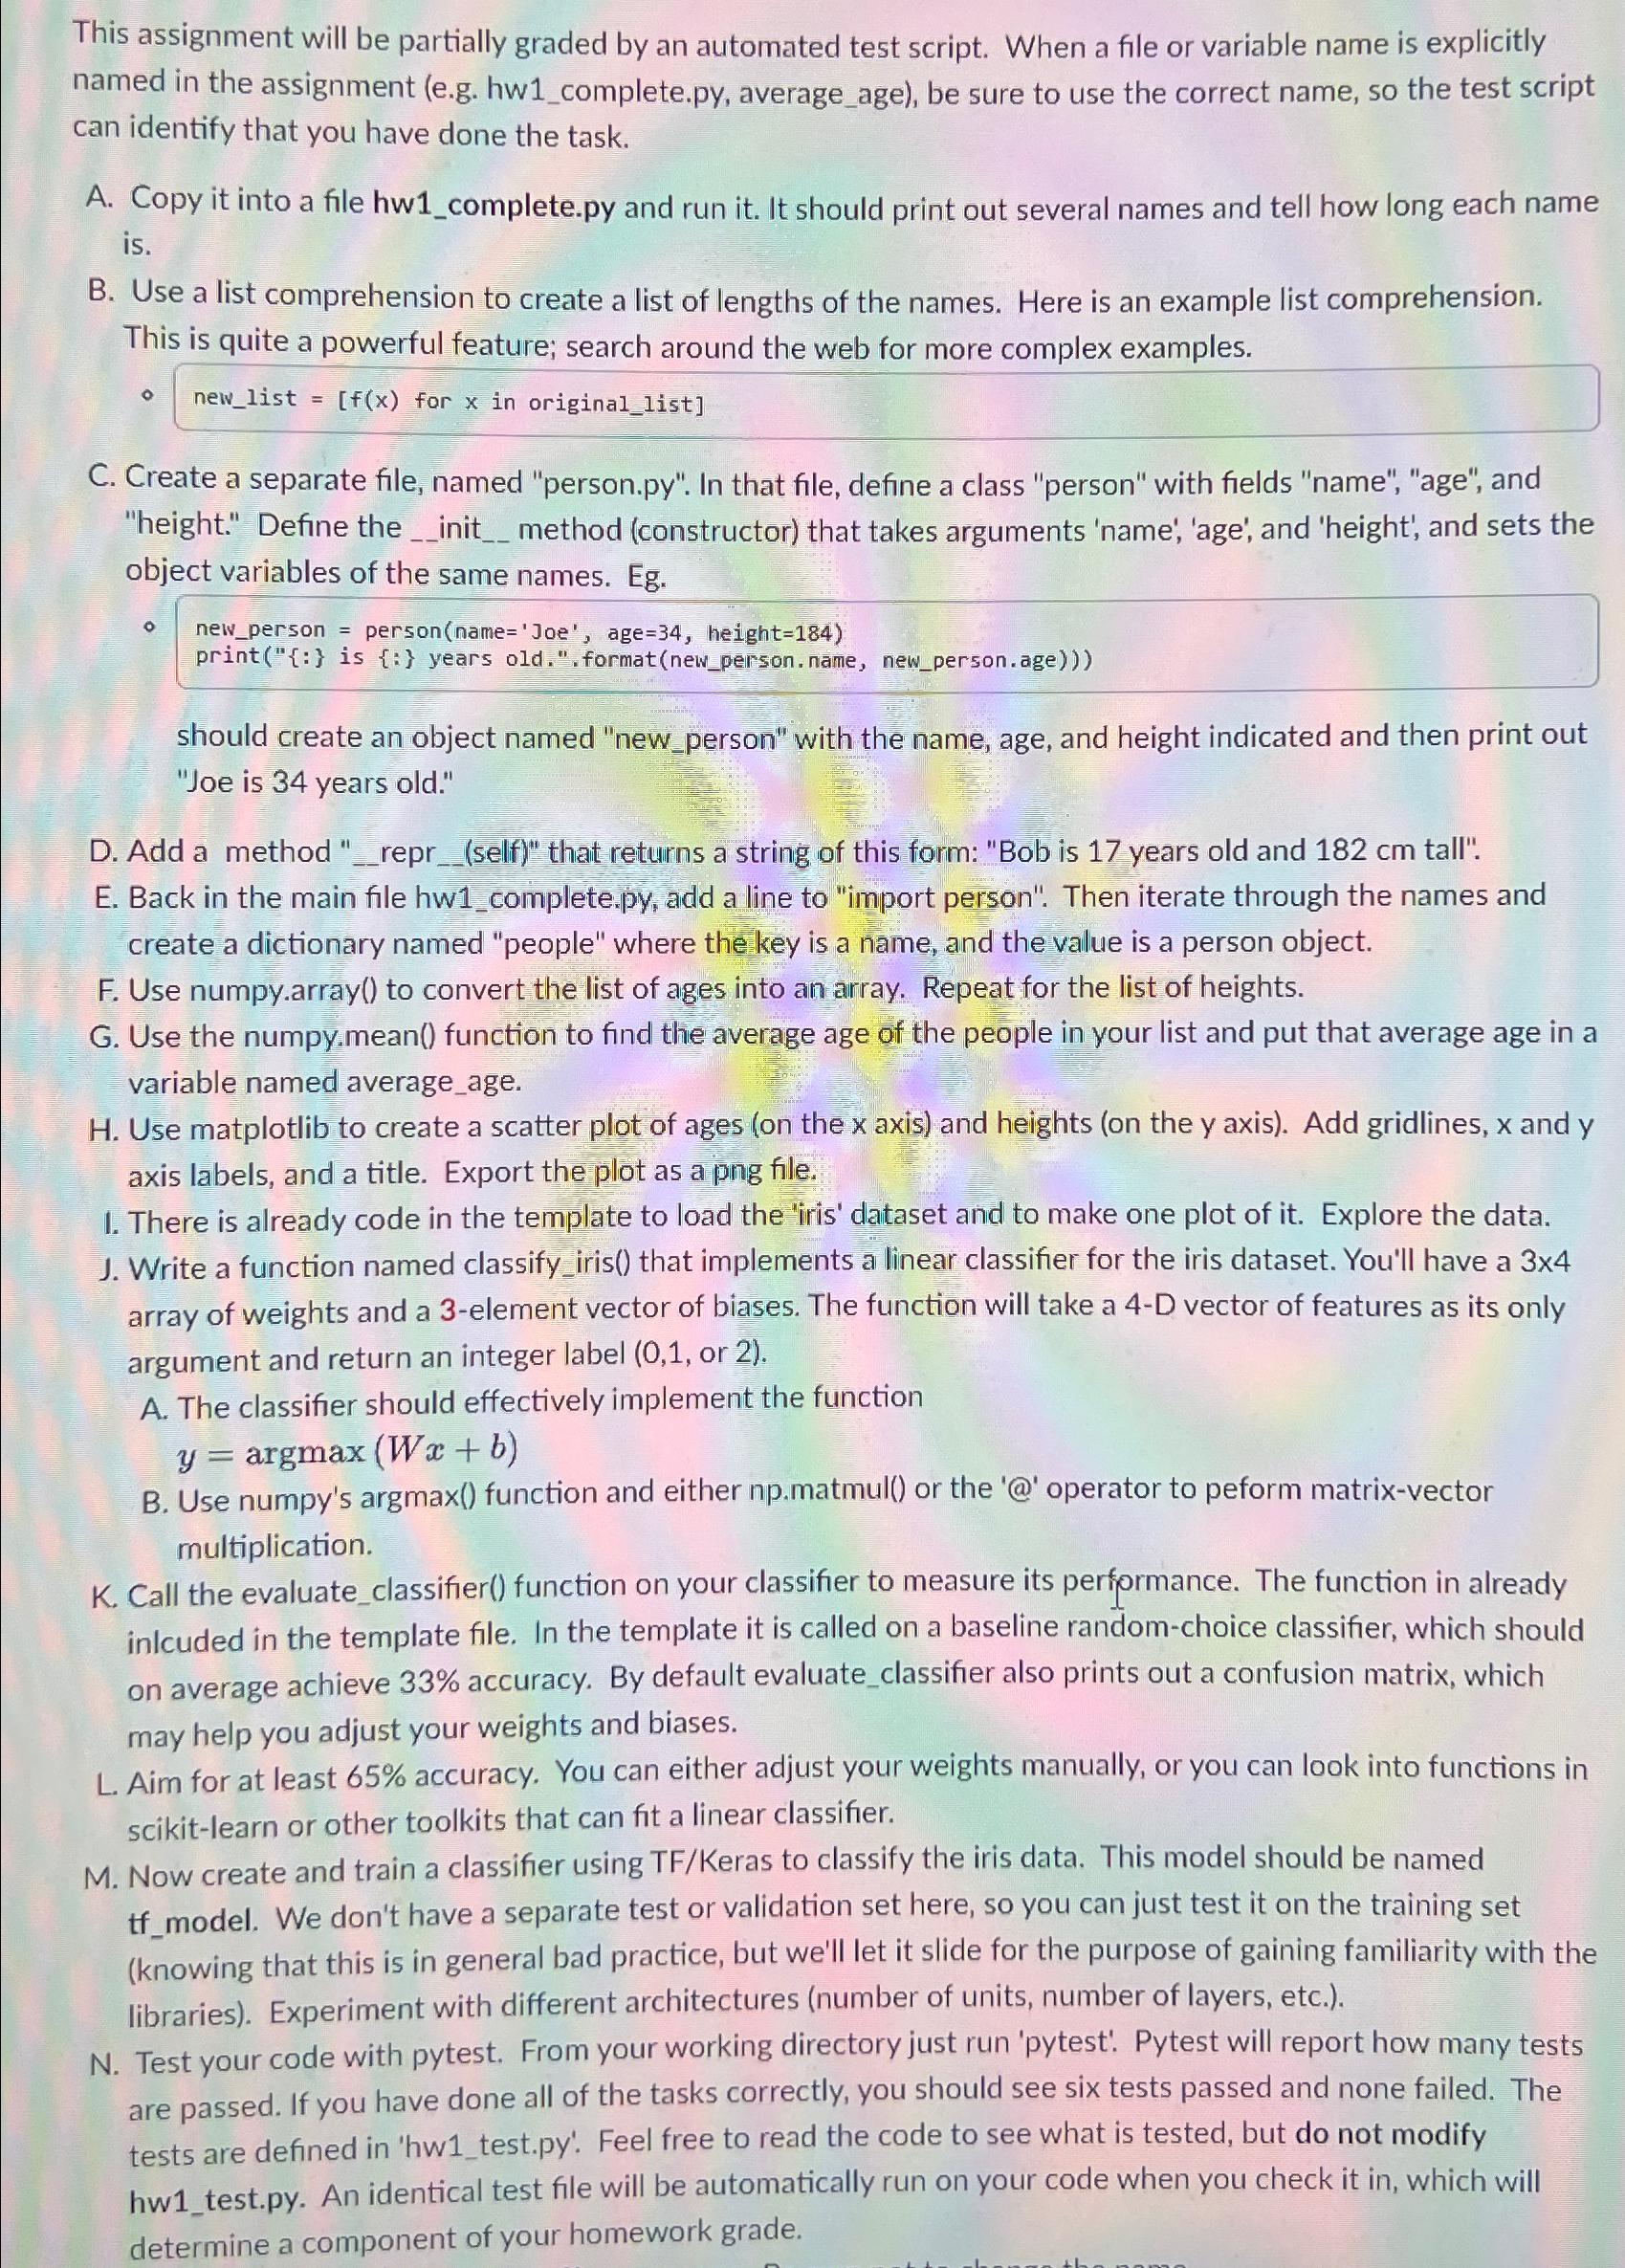
This assignment will be partially graded by an automated test script. When a file or variable name is explicitly named in the assignment ( e
This assignment will be partially graded by an automated test script. When a file or variable name is explicitly named in the assignment eg hwcomplete.py averageage be sure to use the correct name, so the test script can identify that you have done the task.
A Copy it into a file hwcomplete.py and run it It should print out several names and tell how long each name is
B Use a list comprehension to create a list of lengths of the names. Here is an example list comprehension. This is quite a powerful feature; search around the web for more complex examples.
C Create a separate file, named
person.py In that file, define a class "person" with fields "name", "age", and "height." Define the method constructor that takes arguments 'name', 'age', and 'height', and sets the object variables of the same names. Eg
newperson person name 'Joe', age height print is years old.". formatnewperson. name, newperson.age
should create an object named "newperson" with the name, age, and height indicated and then print out "Joe is years old."
D Add a method self that returns a string of this form: "Bob is years old and tall".
E Back in the main file hwcomplete.py add a line to "import person". Then iterate through the names and create a dictionary named "people" where the key is a name, and the value is a person object.
F Use numpy.array to convert the list of ages into an array. Repeat for the list of heights.
G Use the numpy.mean function to find the average age of the people in your list and put that average age in a variable named averageage.
H Use matplotlib to create a scatter plot of ages on the axis and heights on the axis Add gridlines, and axis labels, and a title. Export the plot as a png file.
I. There is already code in the template to load the 'iris' dataset and to make one plot of it Explore the data.
J Write a function named classifyiris that implements a linear classifier for the iris dataset. You'll have a array of weights and a element vector of biases. The function will take a D vector of features as its only argument and return an integer label or

Step by Step Solution
There are 3 Steps involved in it
Step: 1

Get Instant Access to Expert-Tailored Solutions
See step-by-step solutions with expert insights and AI powered tools for academic success
Step: 2

Step: 3

Ace Your Homework with AI
Get the answers you need in no time with our AI-driven, step-by-step assistance
Get Started


