Answered step by step
Verified Expert Solution
Question
1 Approved Answer
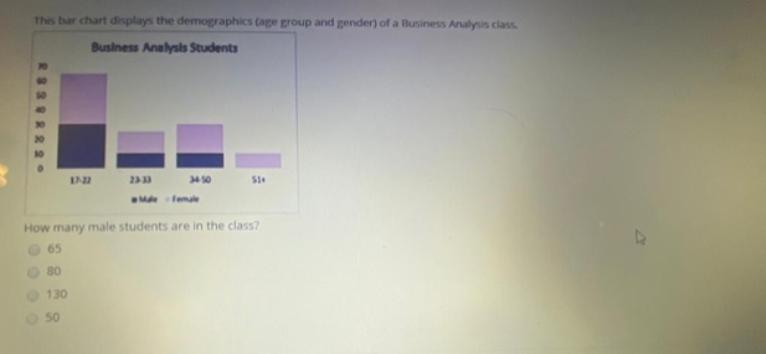
This bar chart displays the demographics (age group and gender) of a Business Analysis class Business Analysts Students 23-33 3410 M lem How many

This bar chart displays the demographics (age group and gender) of a Business Analysis class Business Analysts Students 23-33 3410 M lem How many male students are in the class? 65 80 130 50
Step by Step Solution
★★★★★
3.42 Rating (155 Votes )
There are 3 Steps involved in it
Step: 1
Age Group Noof Males ...
Get Instant Access to Expert-Tailored Solutions
See step-by-step solutions with expert insights and AI powered tools for academic success
Step: 2

Step: 3

Ace Your Homework with AI
Get the answers you need in no time with our AI-driven, step-by-step assistance
Get Started


