

Question
This bottom is the Moores law txt: It looks like a lot but the text is just long. This is all one question but divided
This bottom is the "Moores law txt":
It looks like a lot but the text is just long. This is all one question but divided into multiple parts. I did half of the problem but I need help with the rest. Please do the problem step by step so I can know what I did wrong. Thanks
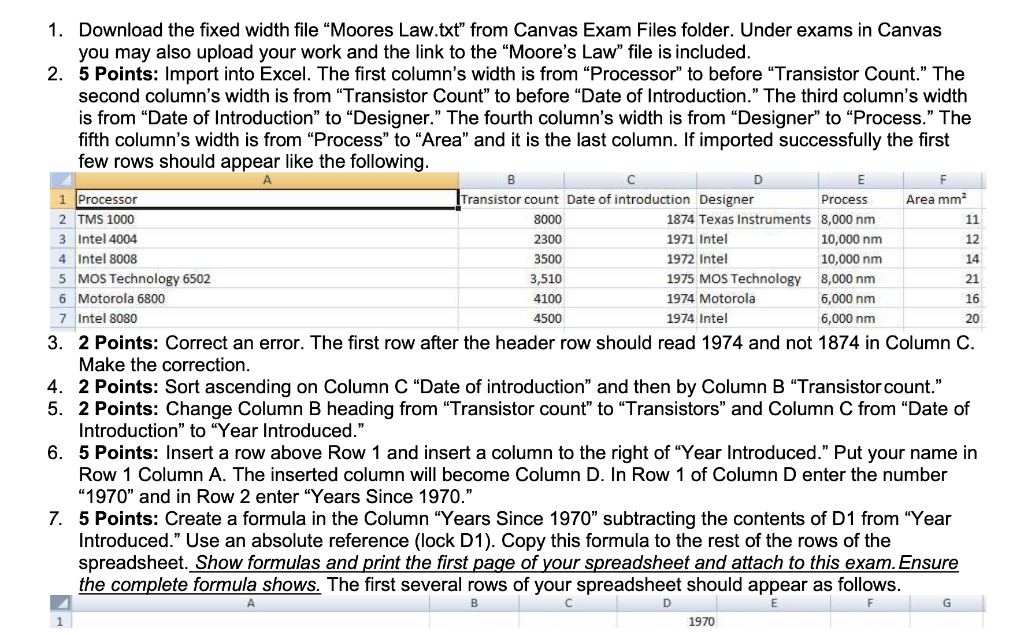
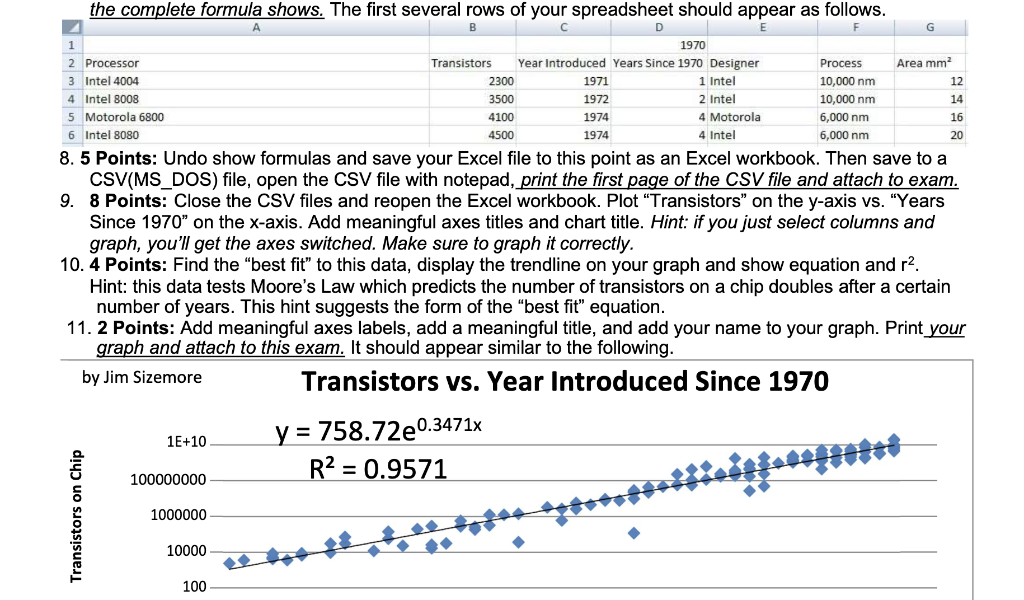
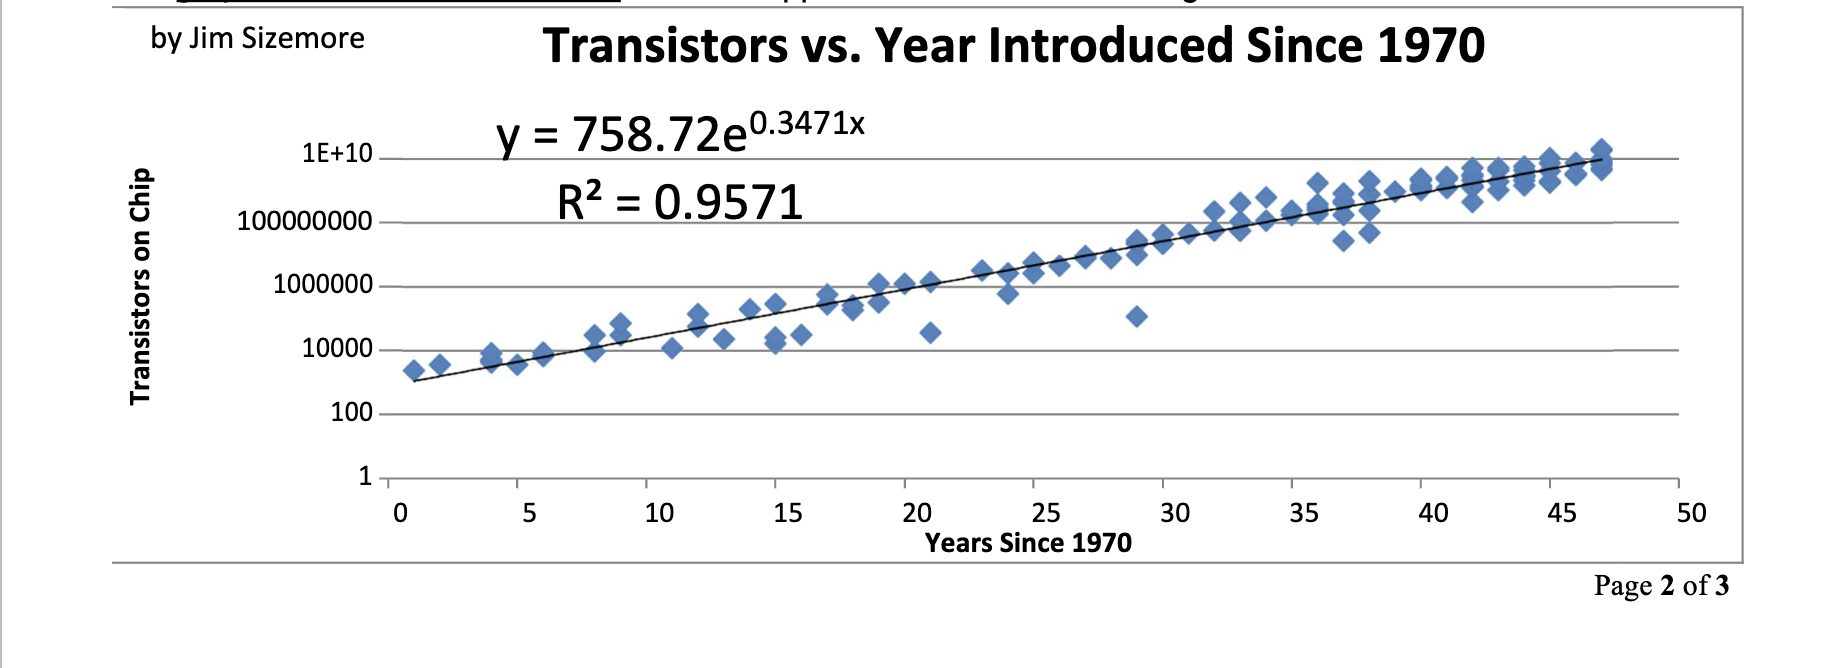
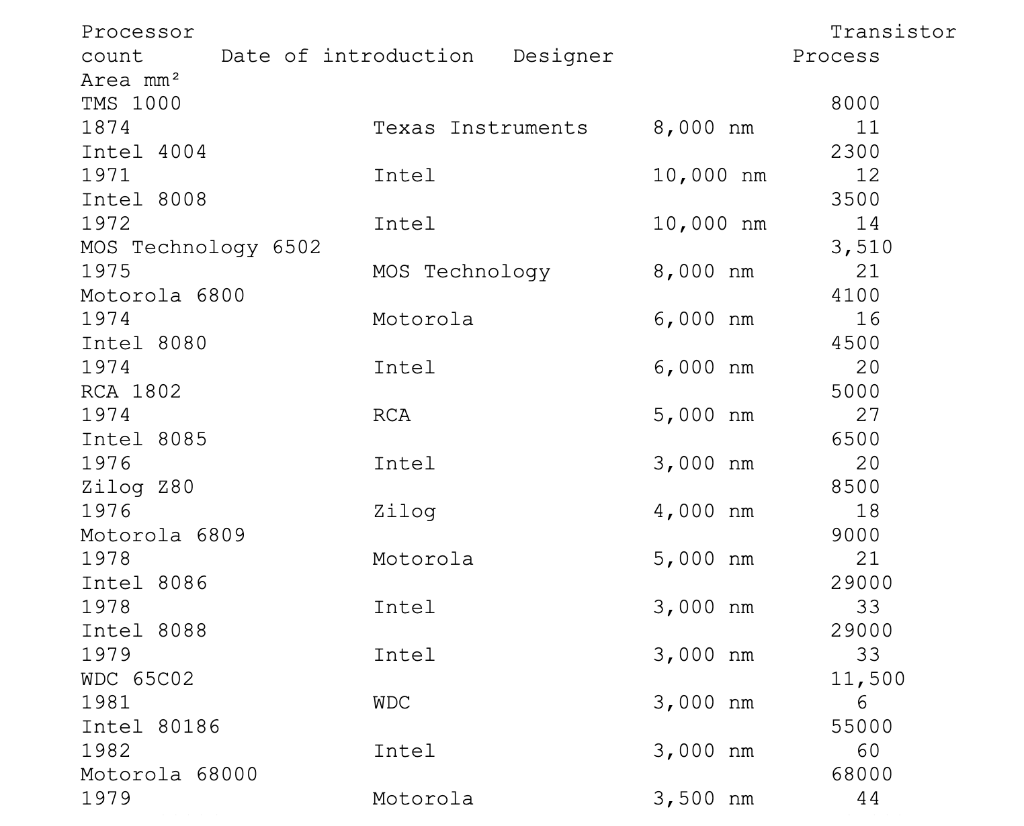
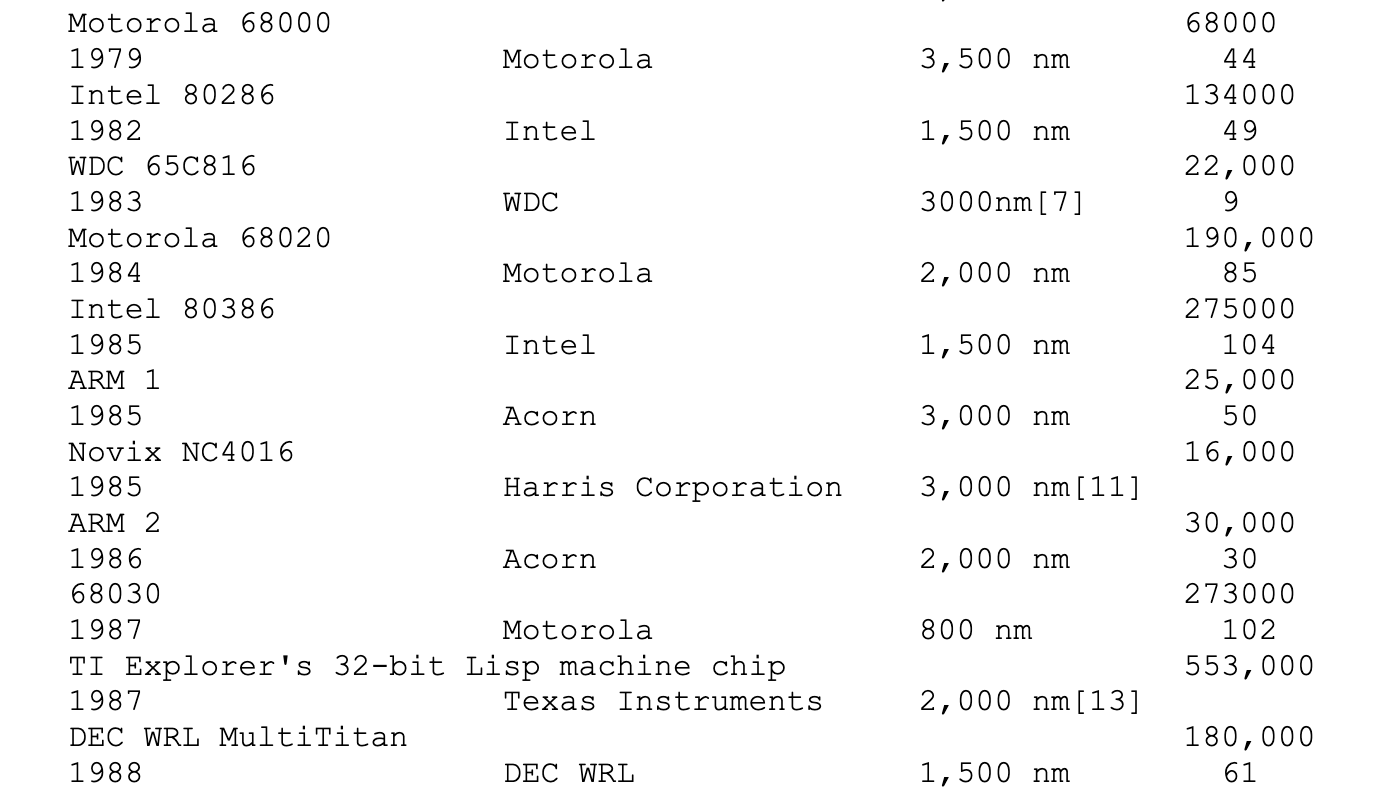
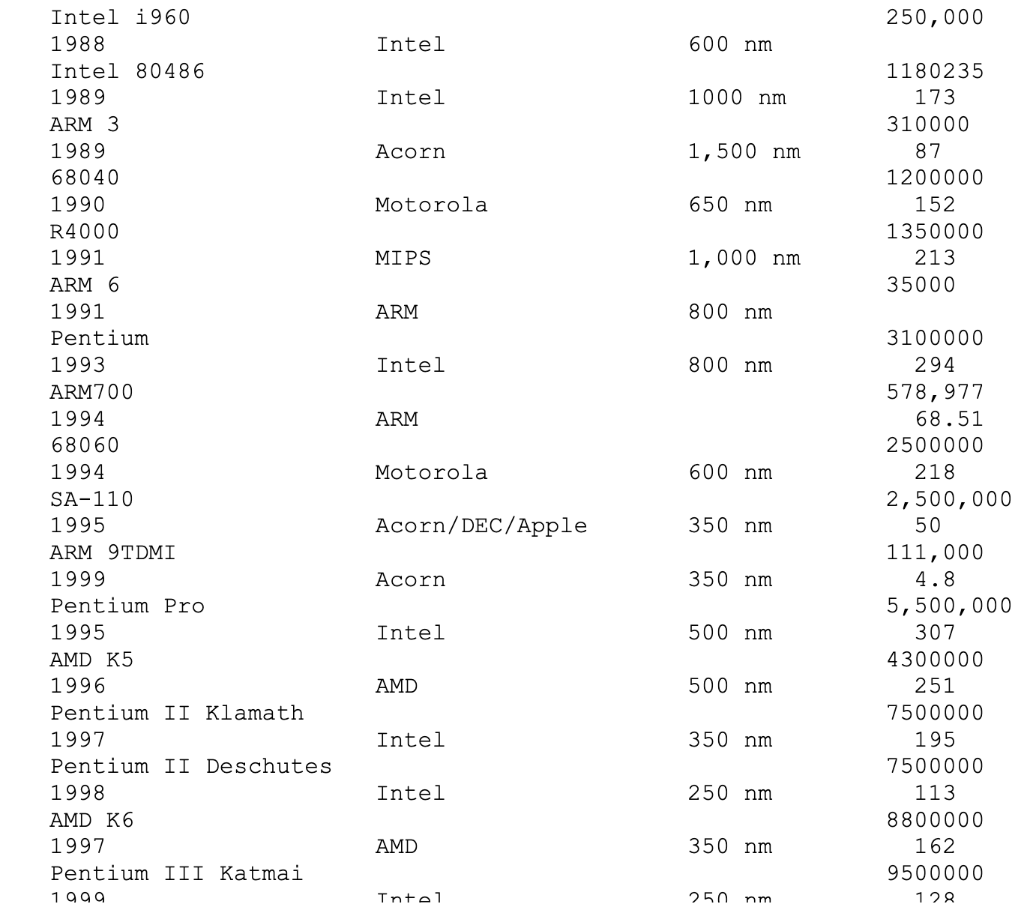
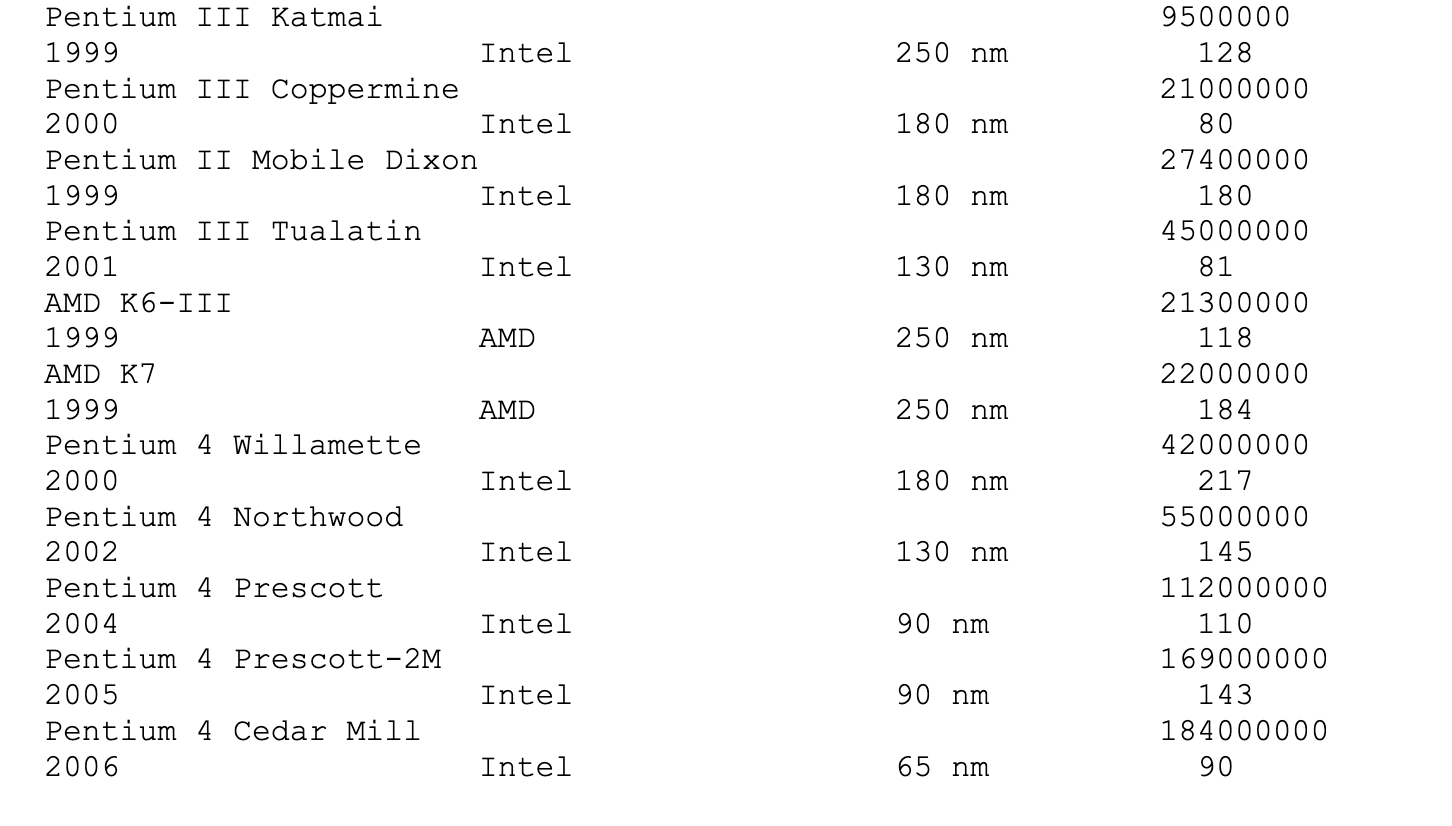
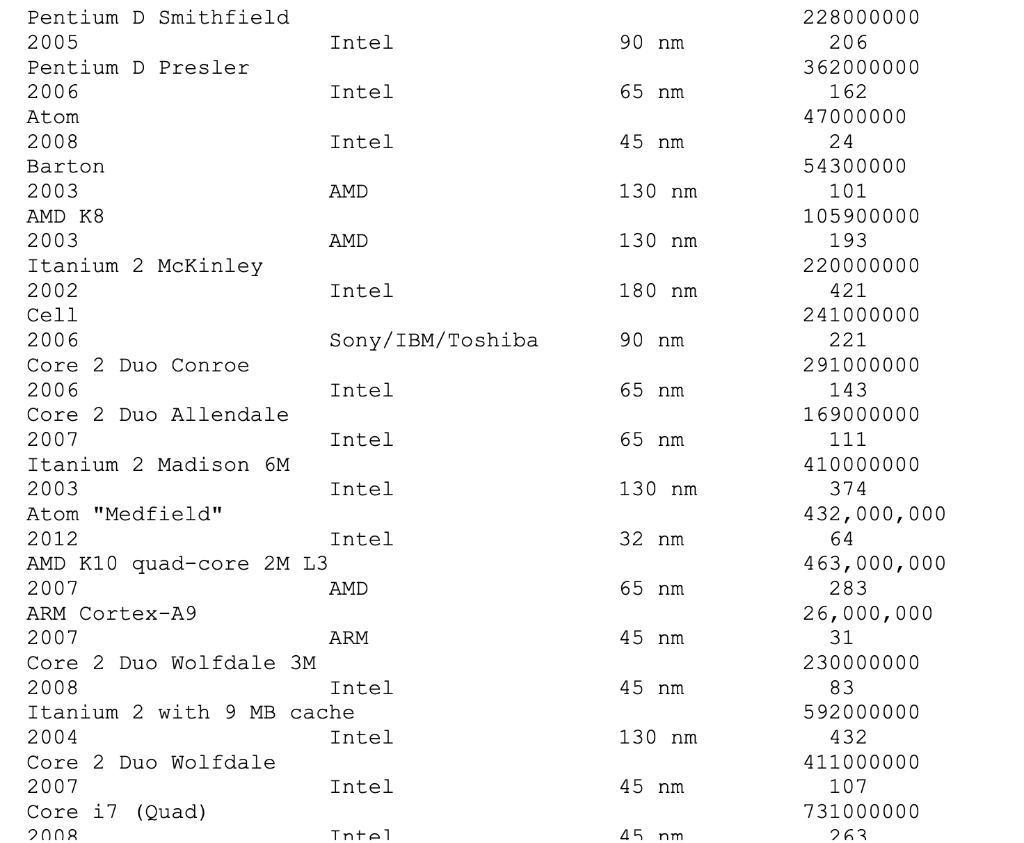
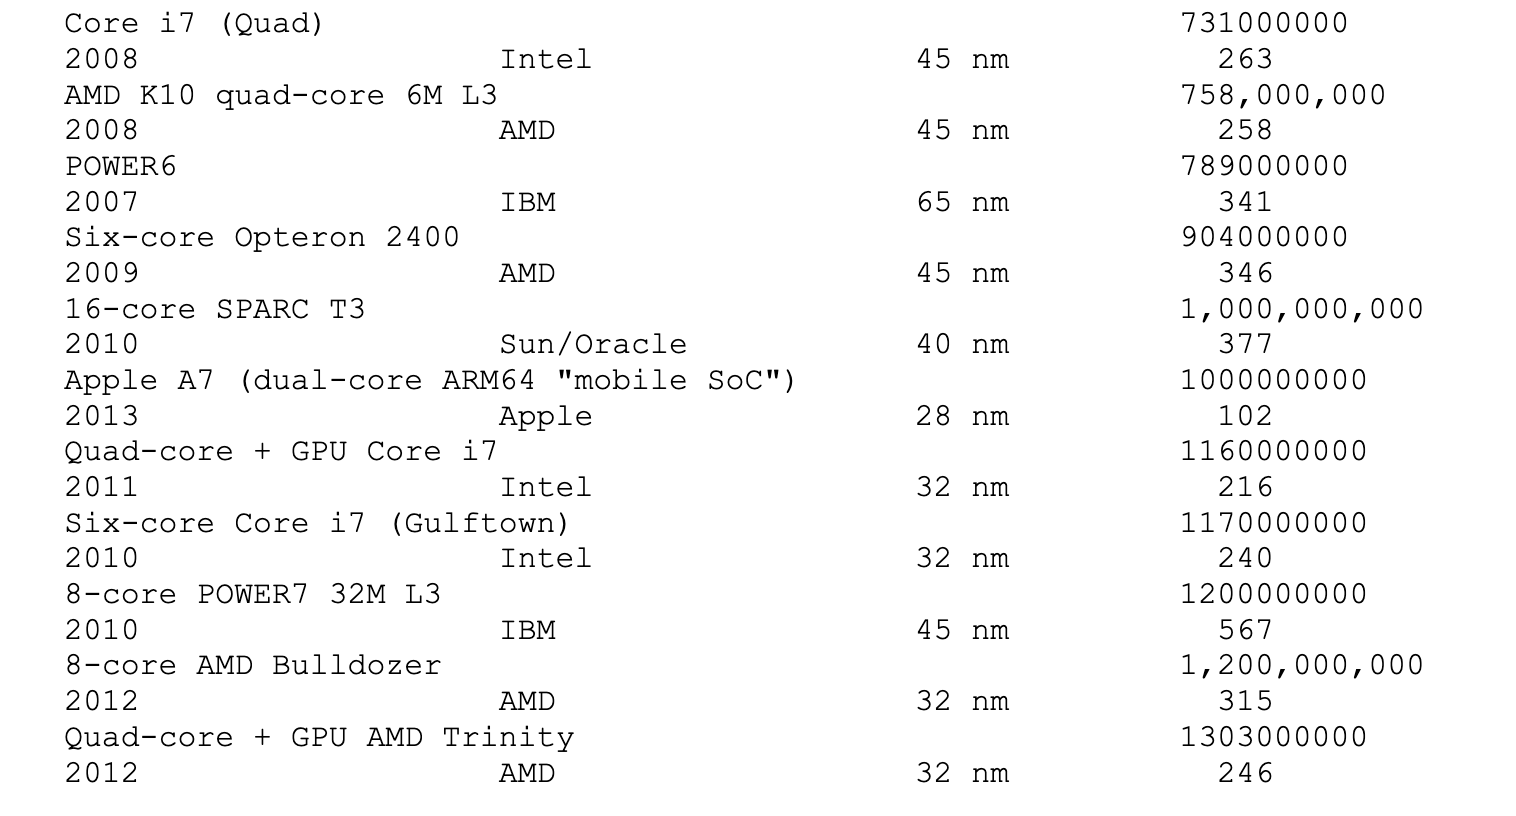
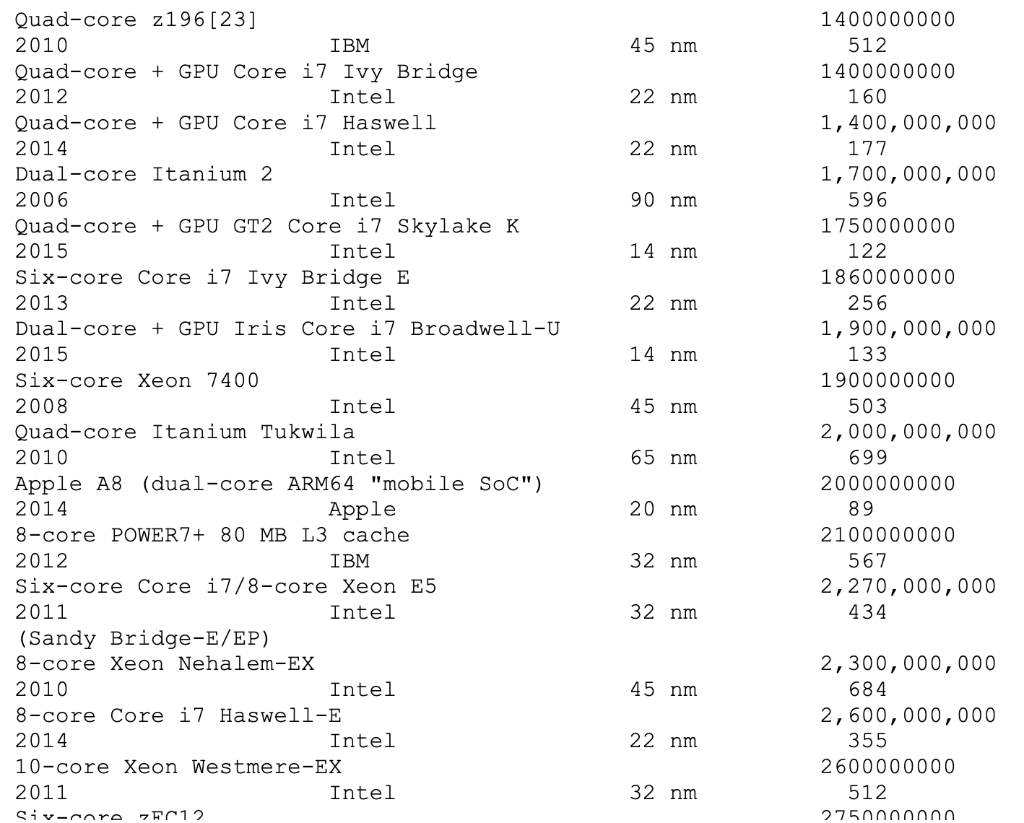
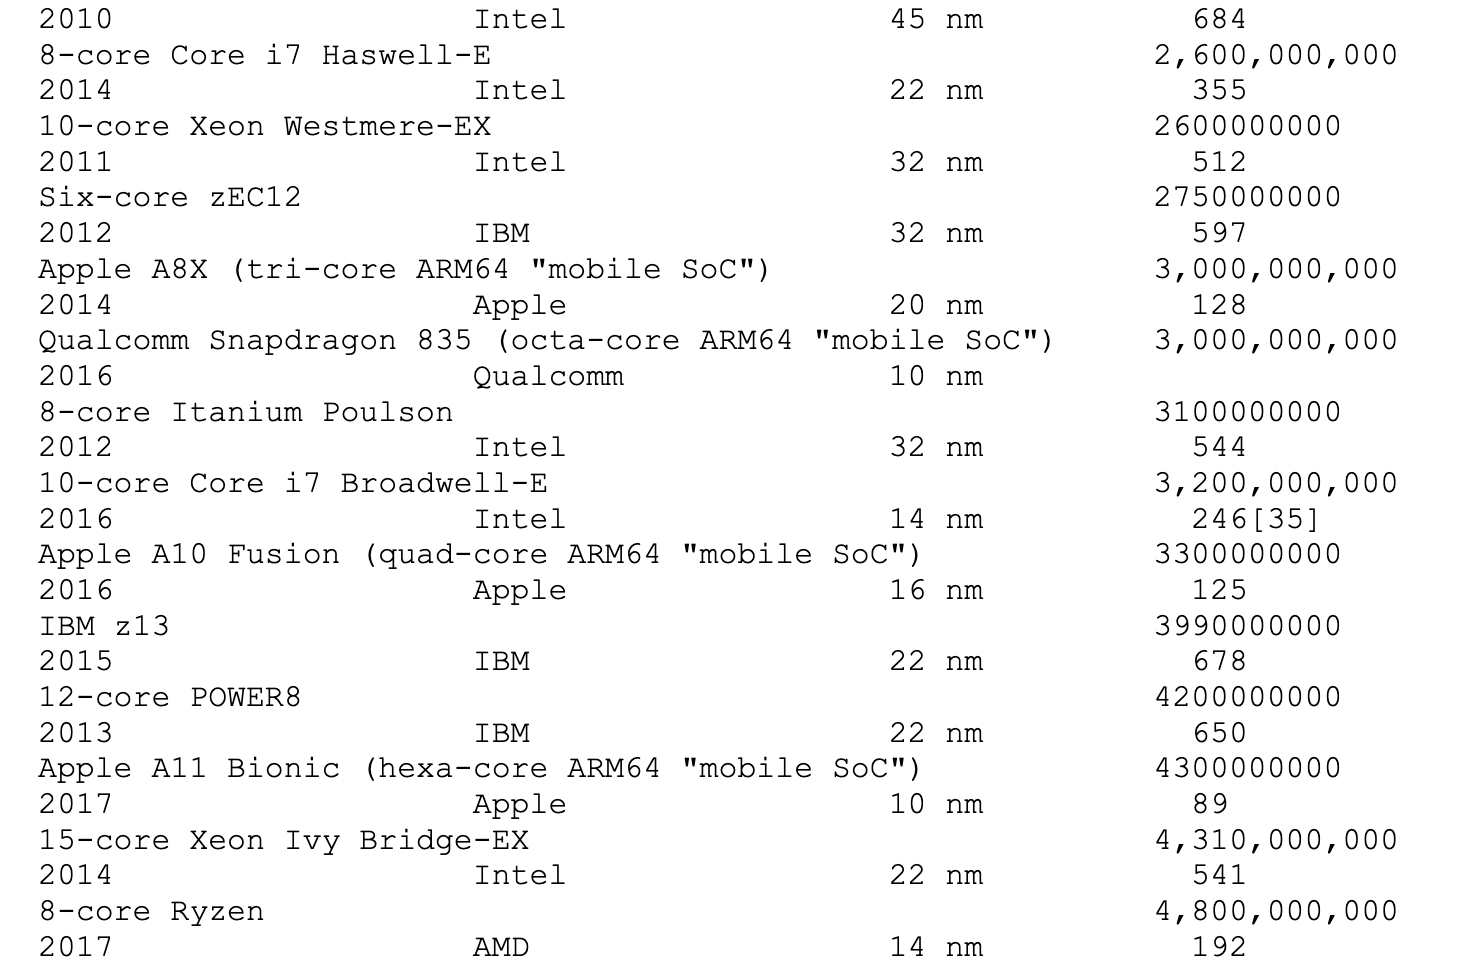
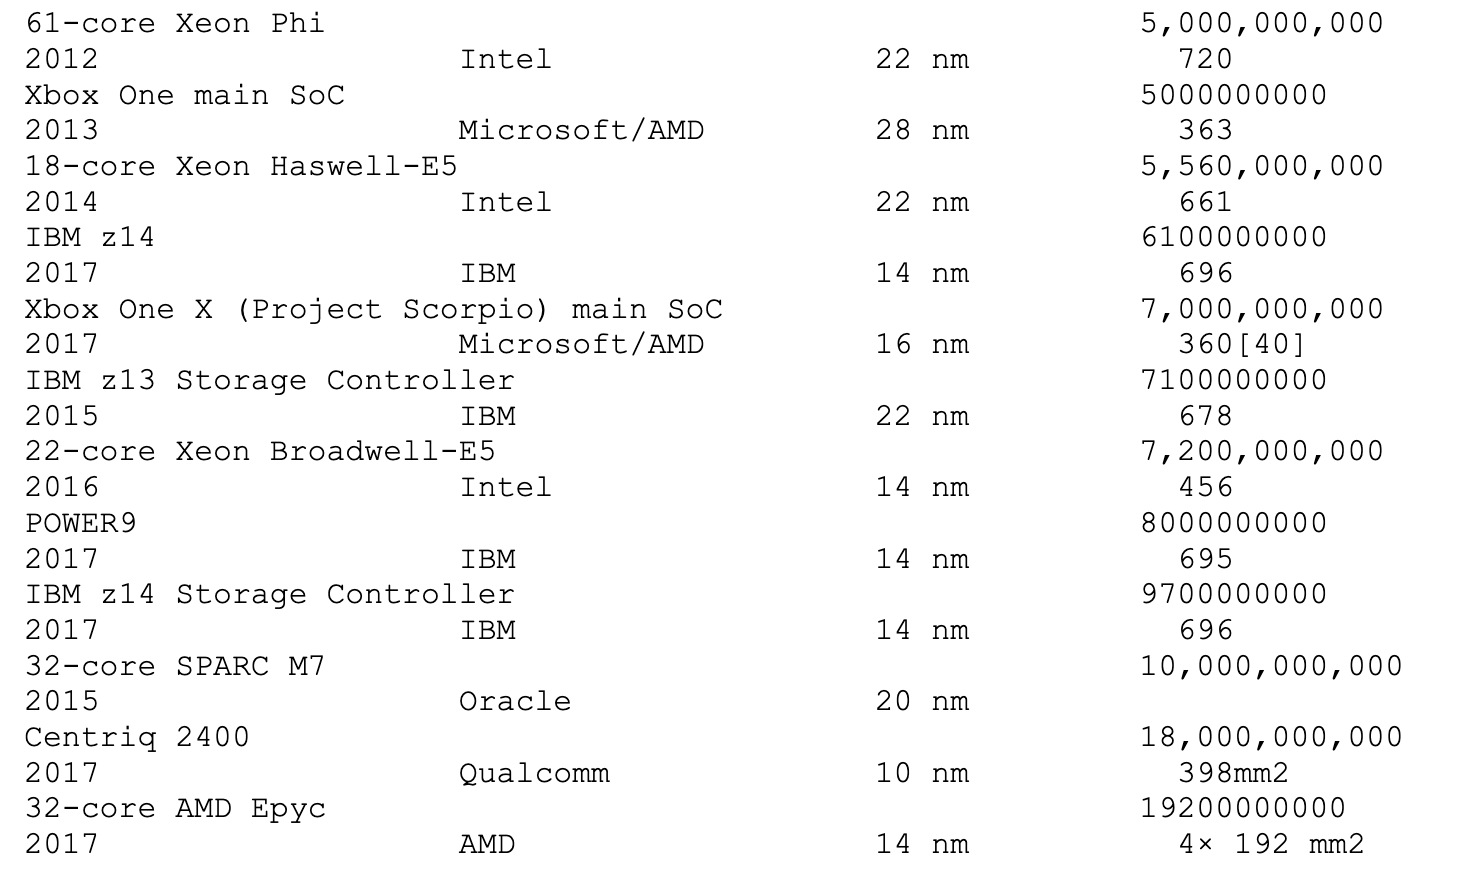
B D E 11 12 14 8,000 nm 21 1. Download the fixed width file "Moores Law.txt" from Canvas Exam Files folder. Under exams in Canvas you may also upload your work and the link to the "Moore's Law" file is included. 2. 5 Points: Import into Excel. The first column's width is from Processor" to before Transistor Count. The second column's width is from "Transistor Count" to before "Date of Introduction." The third column's width is from Date of Introduction" to "Designer." The fourth column's width is from "Designer" to Process." The fifth column's width is from Process" to "Area" and it is the last column. If imported successfully the first few rows should appear like the following. F 1 Processor Transistor count Date of introduction Designer Process Area mm2 2 TMS 1000 8000 1874 Texas Instruments 8,000 nm 3 Intel 4004 2300 1971 Intel 10,000 nm 4 Intel 8008 3500 1972 Intel 10,000 nm 5 MOS Technology 6502 3,510 1975 MOS Technology 6 Motorola 6800 4100 1974 Motorola 6,000 nm 16 7 Intel 8080 4500 1974 Intel 6,000 nm 20 3. 2 Points: Correct an error. The first row after the header row should read 1974 and not 1874 in Column C. Make the correction. 4. 2 Points: Sort ascending on Column C Date of introduction and then by Column B "Transistor count. 5. 2 Points: Change Column B heading from Transistor count to Transistors" and Column C from Date of Introduction" to "Year Introduced." 6. 5 Points: Insert a row above Row 1 and insert a column to the right of "Year Introduced." Put your name in Row 1 Column A. The inserted column will become Column D. In Row 1 of Column D enter the number "1970" and in Row 2 enter "Years Since 1970." 7. 5 Points: Create a formula in the Column "Years Since 1970" subtracting the contents of D1 from "Year Introduced." Use an absolute reference (lock D1). Copy this formula to the rest of the rows of the spreadsheet. Show formulas and print the first page of your spreadsheet and attach to this exam. Ensure the complete formula shows. The first several rows of your spreadsheet should appear as follows. B G 1970 the complete formula shows. The first several rows of your spreadsheet should appear as follows. D 1 2 Processor 3 Intel 4004 4 Intel 8008 5 Motorola 6800 6 Intel 8080 1970 Transistors Year Introduced Years Since 1970 Designer Process Area mm 2300 1971 1 Intel 10,000 nm 12 3500 1972 2 Intel 10,000 nm 14 4100 1974 4 Motorola 6,000 nm 16 4500 1974 4 Intel 6,000 nm 20 8. 5 Points: Undo show formulas and save your Excel file to this point as an Excel workbook. Then save to a CSV(MS_DOS) file, open the CSV file with notepad, print the first page of the CSV file and attach to exam. 9. 8 Points: Close the CSV files and reopen the Excel workbook. Plot Transistors" on the y-axis vs. "Years Since 1970" on the x-axis. Add meaningful axes titles and chart title. Hint: if you just select columns and graph, you'll get the axes switched. Make sure to graph it correctly. 10.4 Points: Find the best fit to this data, display the trendline on your graph and show equation and r2. Hint: this data tests Moore's Law which predicts the number of transistors on a chip doubles after a certain number of years. This hint suggests the form of the "best fit" equation. 11.2 Points: Add meaningful axes labels, add a meaningful title, and add your name to your graph. Print your graph and attach to this exam. It should appear similar to the following. by Jim Sizemore Transistors vs. Year Introduced Since 1970 1E+10 y = 758.72e0.3471x R2 = 0.9571 *** 100000000 Transistors on Chip 1000000 10000 100 by Jim Sizemore Transistors vs. Year Introduced Since 1970 1E+10 y = 758.72e0.3471x R2 = 0.9571 100000000 Transistors on Chip *stoto***ifest-******** 1000000 10000 100 1 T 0 5 10 15 30 35 40 45 50 20 25 Years Since 1970 Page 2 of 3 12. 10 Points: If you extrapolated this trend into the future, what do you think will happen? Do you think the number of transistors on a chip will double every two years as it has in the past or not? Will it slow or accelerate? What can you conclude regarding to how well the fit explains the last 10 or 20 years of information? I'm seeking a thoughtful explanation demonstrating understanding of what fitting means and predicts. Also, your general engineering knowledge that might give you insight into this data. Hint: Try plugging in numbers into your equation to see what happens over time. 13. 20 Points: Using SOLVE, develop a plan to measure the height of a landmark such as a flagpole, streetlight, telephone pole, etc. You get to choose the technique you will use to accomplish this, but don't use sophisticated tools like laser ranging, etc. You may use tools that may have been available 400 years ago such as protractors, rulers or tape measure, string, plumb bobs (weight at the end of a string), methods to sight along a line (e.g., a straw), etc. Explain your procedure well. Show your SOLVE steps and embed an image, if needed. You may type your SOLVE steps if that makes sense. If you use equations, leave them in symbolic form. Transistor Process 8,000 nm 10,000 nm 10,000 nm 8,000 nm 6,000 nm 6,000 nm Processor count Date of introduction Designer Area mm2 TMS 1000 1874 Texas Instruments Intel 4004 1971 Intel Intel 8008 1972 Intel MOS Technology 6502 1975 MOS Technology Motorola 6800 1974 Motorola Intel 8080 1974 Intel RCA 1802 1974 RCA Intel 8085 1976 Intel Zilog 280 1976 Zilog Motorola 6809 1978 Motorola Intel 8086 1978 Intel Intel 8088 1979 Intel WDC 65C02 1981 WDC Intel 80186 1982 Intel Motorola 68000 1979 Motorola 5,000 nm 8000 11 2300 12 3500 14 3,510 21 4100 16 4500 20 5000 27 6500 20 8500 18 9000 21 29000 33 29000 33 11,500 6 55000 60 68000 44 3,000 nm 4,000 nm 5,000 nm 3,000 nm 3,000 nm 3,000 nm 3,000 nm 3,500 nm 3,500 nm 1,500 nm 3000nm [7] 68000 44 134000 49 22,000 9 190,000 85 275000 104 25,000 50 16,000 2,000 nm Motorola 68000 1979 Motorola Intel 80286 1982 Intel WDC 65C816 1983 WDC Motorola 68020 1984 Motorola Intel 80386 1985 Intel ARM 1 1985 Acorn Novix NC4016 1985 Harris Corporation ARM 2 1986 Acorn 68030 1987 Motorola TI Explorer's 32-bit Lisp machine chip 1987 Texas Instruments DEC WRL MultiTitan 1988 DEC WRL 1,500 nm 3,000 nm 3,000 nm[11] 2,000 nm 30,000 30 273000 102 553,000 800 nm 2,000 nm [13] 180,000 61 1,500 nm 250,000 Intel 600 nm Intel 1000 nm Acorn 1,500 nm 1180235 173 310000 87 1200000 152 1350000 213 35000 Motorola 650 nm MIPS 1,000 nm ARM 800 nm Intel 800 nm ARM Intel i960 1988 Intel 80486 1989 ARM 3 1989 68040 1990 R4000 1991 ARM 6 1991 Pentium 1993 ARM700 1994 68060 1994 SA-110 1995 ARM 9TDMI 1999 Pentium Pro 1995 AMD K5 1996 Pentium II Klamath 1997 Pentium II Des chutes 1998 AMD K6 1997 Pentium III Katmai 1999 Motorola 600 nm Acorn/DEC/Apple 350 nm Acorn 350 nm 3100000 294 578,977 68.51 2500000 218 2,500,000 50 111,000 4.8 5,500,000 307 4300000 251 7500000 195 7500000 113 8800000 162 9500000 128 Intel 500 nm AMD 500 nm Intel 350 nm Intel 250 nm AMD 350 nm Intel 250 nm 250 nm 180 nm 180 nm 130 nm 250 nm Pentium III Katmai 1999 Intel Pentium III Coppermine 2000 Intel Pentium II Mobile Dixon 1999 Intel Pentium III Tualatin 2001 Intel AMD K6-III 1999 AMD AMD K7 1999 AMD Pentium 4 Willamette 2000 Intel Pentium 4 Northwood 2002 Intel Pentium 4 Prescott 2004 Intel Pentium 4 Prescott-2M 2005 Intel Pentium 4 Cedar Mill 2006 Intel 9500000 128 21000000 80 27400000 180 45000000 81 21300000 118 22000000 184 42000000 217 55000000 145 112000000 110 169000000 143 184000000 90 250 nm 180 nm 130 nm 90 nm 90 nm 65 nm 90 nm 65 nm 45 nm 130 nm AMD 130 nm 180 nm 90 nm 65 nm Pentium D Smithfield 2005 Intel Pentium D Presler 2006 Intel Atom 2008 Intel Barton 2003 AMD AMD K8 2003 Itanium 2 McKinley 2002 Intel Cell 2006 Sony/IBM/Toshiba Core 2 Duo Conroe 2006 Intel Core 2 Duo Allendale 2007 Intel Itanium 2 Madison 6M 2003 Intel Atom "Medfield" 2012 Intel AMD K10 quad-core 2M L3 2007 AMD ARM Cortex-A9 2007 ARM Core 2 Duo Wolfdale 3M 2008 Intel Itanium 2 with 9 MB cache 2004 Intel Core 2 Duo Wolfdale 2007 Intel Core i7 (Quad) 2008 Tntel 228000000 206 362000000 162 47000000 24 54300000 101 105900000 193 220000000 421 241000000 221 291000000 143 169000000 111 410000000 374 432,000,000 64 463,000,000 283 26,000,000 31 230000000 83 592000000 432 411000000 107 731000000 263 65 nm 130 nm 32 nm 65 nm 45 nm 45 nm 130 nm 45 nm 45 nm 45 nm 45 nm 65 nm 45 nm 40 nm Core i7 (Quad) 2008 Intel AMD K10 quad-core 6M L3 2008 AMD POWER6 2007 IBM Six-core Opteron 2400 2009 AMD 16-core SPARC T3 2010 Sun/Oracle Apple A7 (dual-core ARM64 "mobile SOC") 2013 Apple Quad-core + GPU Core i7 2011 Intel Six-core Core i7 (Gulftown) 2010 Intel 8-core POWER7 32M L3 2010 IBM 8-core AMD Bulldozer 2012 AMD Quad-core + GPU AMD Trinity 2012 AMD 731000000 263 758,000,000 258 789000000 341 904000000 346 1,000,000,000 377 1000000000 102 1160000000 216 1170000000 240 1200000000 567 1,200,000,000 315 1303000000 246 28 nm 32 nm 32 nm 45 nm 32 nm 32 nm 45 nm 22 nm 22 nm 90 nm 14 nm 22 nm 1400000000 512 1400000000 160 1,400,000,000 177 1,700,000,000 596 1750000000 122 1860000000 256 1,900,000,000 133 1900000000 503 2,000,000,000 699 2000000000 89 2100000000 567 2,270,000,000 434 14 nm Quad-core 2196[23] 2010 IBM Quad-core + GPU Core i7 Ivy Bridge 2012 Intel Quad-core + GPU Core i7 Haswell 2014 Intel Dual-core Itanium 2 2006 Intel Quad-core + GPU GT2 Core i7 Skylake K 2015 Intel Six-core Core i7 Ivy Bridge E 2013 Intel Dual-core + GPU Iris Core i7 Broadwell-U 2015 Intel Six-core Xeon 7400 2008 Intel Quad-core Itanium Tukwila 2010 Intel Apple A8 (dual-core ARM64 "mobile SoC") 2014 Apple 8-core POWER7+ 80 MB L3 cache 2012 IBM Six-core Core i7/8-core Xeon E5 2011 Intel (Sandy Bridge-E/EP) 8-core Xeon Nehalem-EX 2010 Intel 8-core Core i7 Haswell-E 2014 Intel 10-core Xeon Westmere-EX 2011 Intel Sivrare ZC12 45 nm 65 nm 20 nm 32 nm 32 nm 45 nm 22 nm 2,300,000,000 684 2,600,000,000 355 2600000000 512 2750nnnnn 32 nm 22 nm 684 2,600,000,000 355 2600000000 512 2750000000 597 3,000,000,000 128 3,000,000,000 2010 Intel 45 nm 8-core Core i7 Haswell-E 2014 Intel 10-core Xeon Westmere-EX 2011 Intel 32 nm Six-core zEC12 2012 IBM 32 nm Apple A8X (tri-core ARM64 "mobile SOC") 2014 Apple 20 nm Qualcomm Snapdragon 835 (octa-core ARM64 "mobile SOC") 2016 Qualcomm 10 nm 8-core Itanium Poulson 2012 Intel 32 nm 10-core Core i7 Broadwell-E 2016 Intel 14 nm Apple A10 Fusion (quad-core ARM64 "mobile SOC") 2016 Apple 16 nm IBM 213 2015 IBM 22 nm 12-core POWERS 2013 IBM 22 nm Apple A11 Bionic (hexa-core ARM64 "mobile SOC") 2017 Apple 10 nm 15-core Xeon Ivy Bridge-EX 2014 Intel 22 nm 8-core Ryzen 2017 AMD 14 nm 3100000000 544 3,200,000,000 246[35] 3300000000 125 3990000000 678 4200000000 650 4300000000 89 4,310,000,000 541 4,800,000,000 192 22 nm 28 nm 22 nm 14 nm 16 nm 5,000,000,000 720 5000000000 363 5,560,000,000 661 6100000000 696 7,000,000,000 360[40] 7100000000 678 7,200,000,000 456 8000000000 695 9700000000 696 10,000,000,000 61-core Xeon Phi 2012 Intel Xbox One main SOC 2013 Microsoft/AMD 18-core Xeon Haswell-E5 2014 Intel IBM 214 2017 IBM Xbox One X (Project Scorpio) main Soc 2017 Microsoft/AMD IBM 213 Storage Controller 2015 IBM 22-core Xeon Broadwell-E5 2016 Intel POWER9 2017 IBM IBM z14 Storage Controller 2017 IBM 32-core SPARC M7 2015 Oracle Centriq 2400 2017 Qualcomm 32-core AMD Epyc 2017 AMD 22 nm 14 nm 14 nm 14 nm 20 nm 10 nm 18,000,000,000 398mm2 19200000000 4x 192 mm2 14 nmStep by Step Solution
There are 3 Steps involved in it
Step: 1

Get Instant Access to Expert-Tailored Solutions
See step-by-step solutions with expert insights and AI powered tools for academic success
Step: 2

Step: 3
Ace Your Homework with AI
Get the answers you need in no time with our AI-driven, step-by-step assistance
Get Started
Excel As Your Database
Authors: Paul Cornell
1st Edition
1590597516, 978-1590597514