Answered step by step
Verified Expert Solution
Question
1 Approved Answer
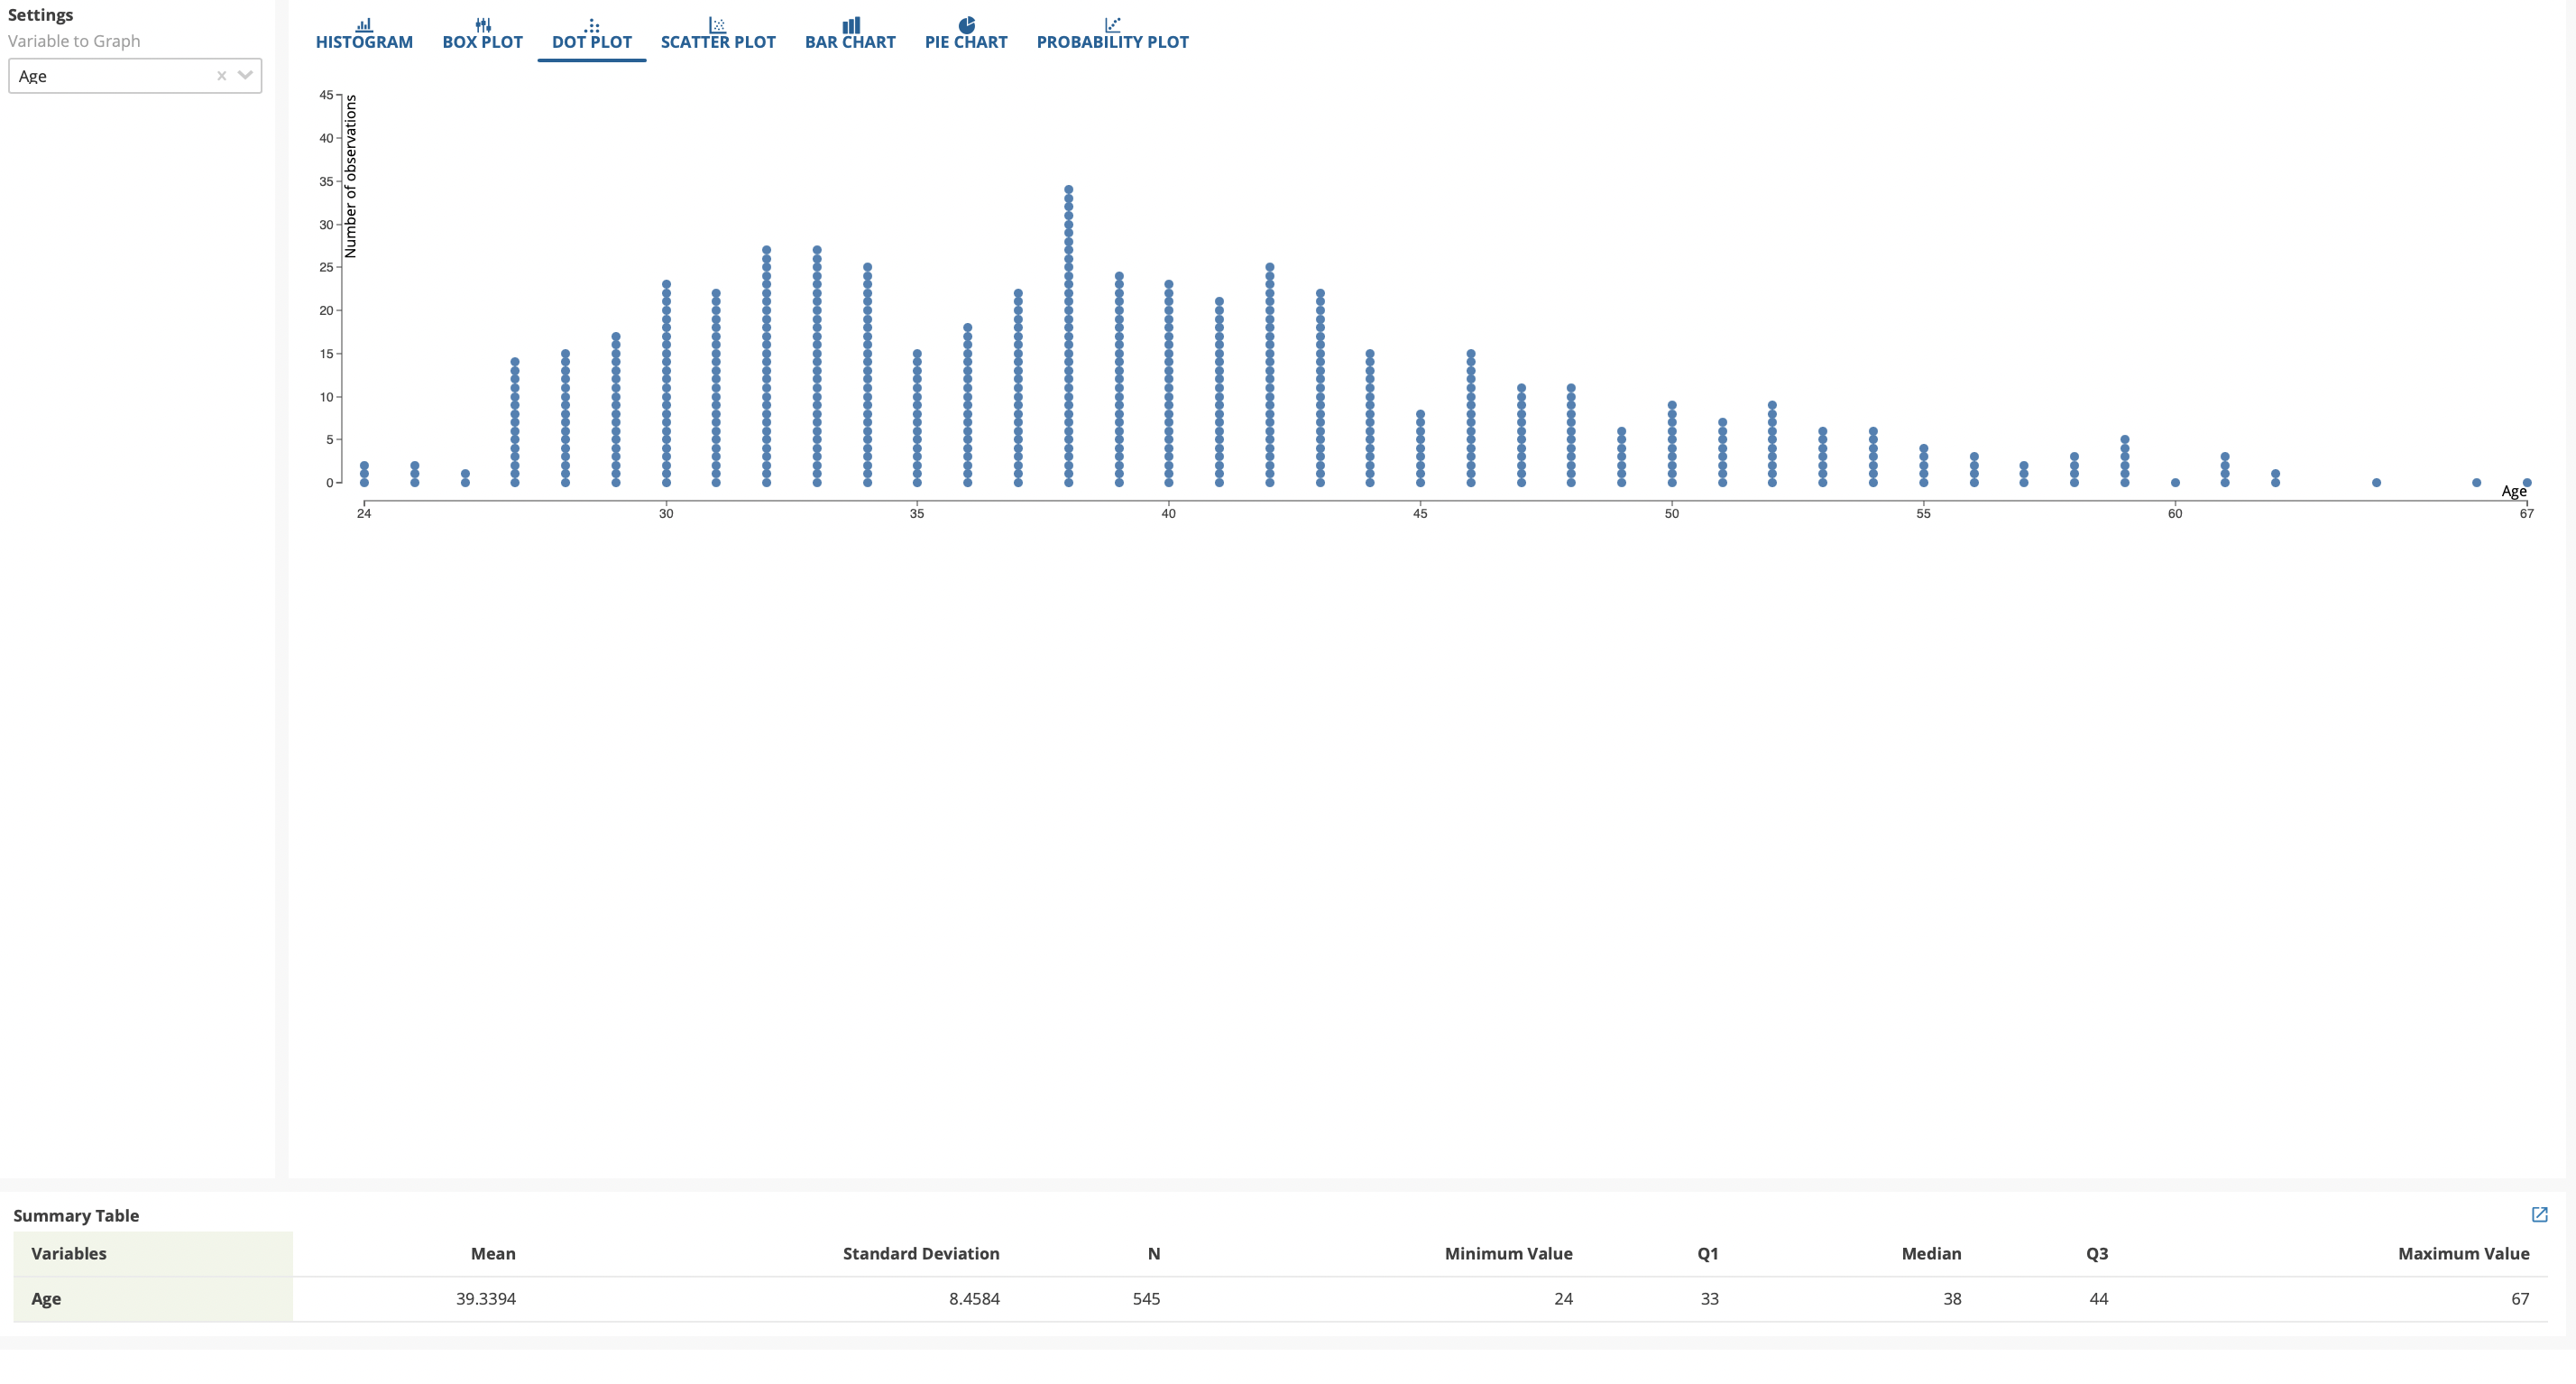
This box plot shows 545 different ages of individuals who are incarcerated. Please provide an analysis of the box plot below. Please note of any
This box plot shows 545 different ages of individuals who are incarcerated. Please provide an analysis of the box plot below. Please note of any cluster groups, lows, highs, and outliers.

Step by Step Solution
There are 3 Steps involved in it
Step: 1

Get Instant Access to Expert-Tailored Solutions
See step-by-step solutions with expert insights and AI powered tools for academic success
Step: 2

Step: 3

Ace Your Homework with AI
Get the answers you need in no time with our AI-driven, step-by-step assistance
Get Started


