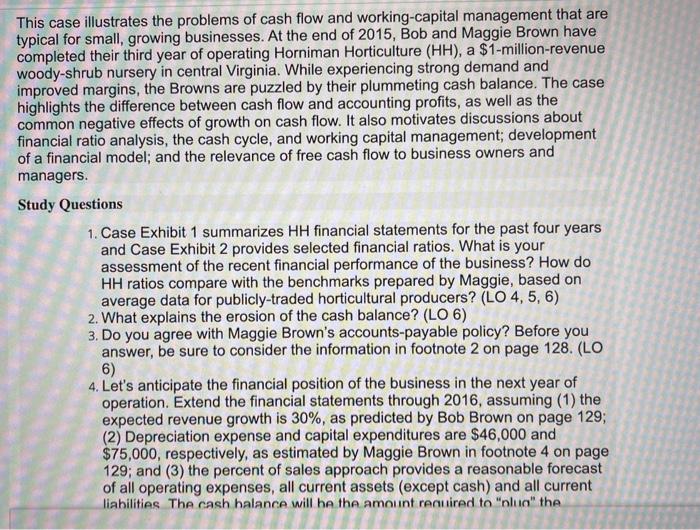
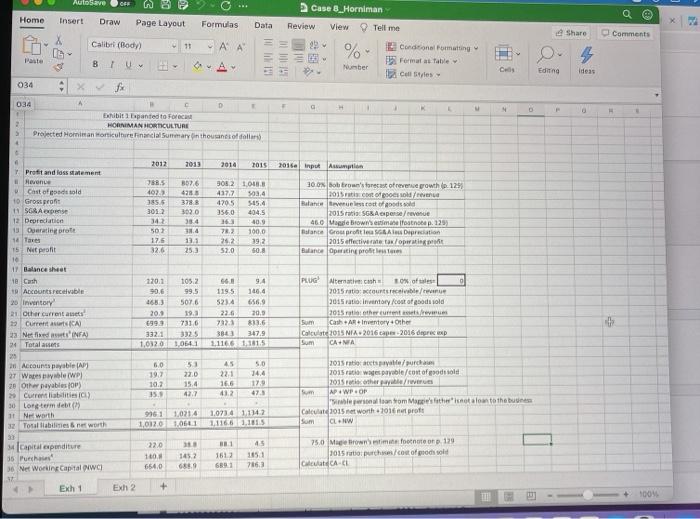
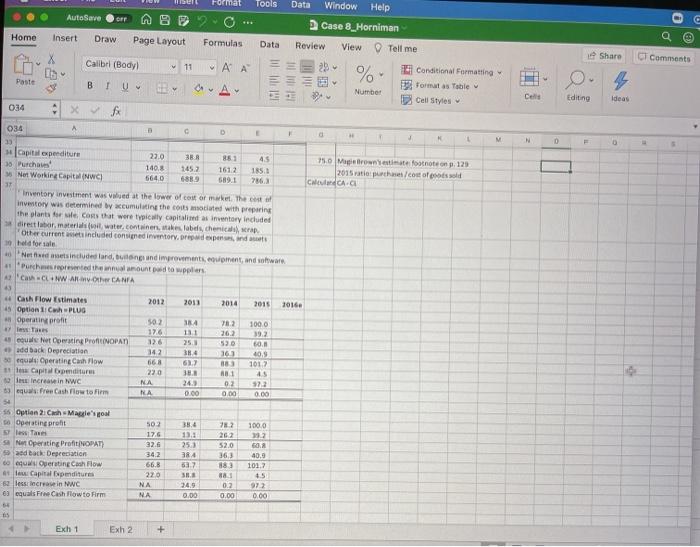
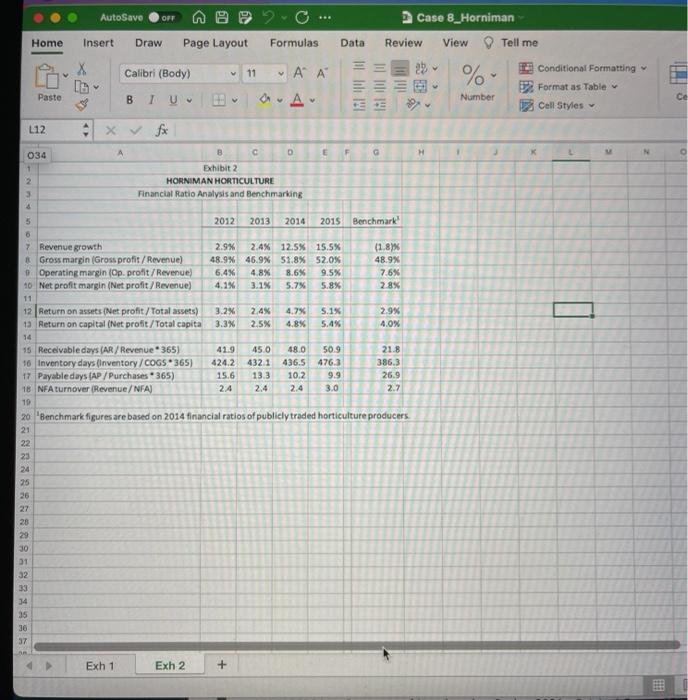
This case illustrates the problems of cash flow and working-capital management that are typical for small, growing businesses. At the end of 2015, Bob and Maggie Brown have completed their third year of operating Horniman Horticulture (HH), a $1-million-revenue woody-shrub nursery in central Virginia. While experiencing strong demand and improved margins, the Browns are puzzled by their plummeting cash balance. The case highlights the difference between cash flow and accounting profits, as well as the common negative effects of growth on cash flow. It also motivates discussions about financial ratio analysis, the cash cycle, and working capital management; development of a financial model; and the relevance of free cash flow to business owners and managers. Study Questions 1. Case Exhibit 1 summarizes HH financial statements for the past four years and Case Exhibit 2 provides selected financial ratios. What is your assessment of the recent financial performance of the business? How do HH ratios compare with the benchmarks prepared by Maggie, based on average data for publicly-traded horticultural producers? (LO 4,5,6) 2. What explains the erosion of the cash balance? (LO 6) 3. Do you agree with Maggie Brown's accounts payable policy? Before you answer, be sure to consider the information in footnote 2 on page 128. (LO 6) 4. Let's anticipate the financial position of the business in the next year of operation. Extend the financial statements through 2016, assuming (1) the expected revenue growth is 30%, as predicted by Bob Brown on page 129; (2) Depreciation expense and capital expenditures are $46,000 and $75,000, respectively, as estimated by Maggie Brown in footnote 4 on page 129; and (3) the percent of sales approach provides a reasonable forecast of all operating expenses, all current assets (except cash) and all current liabilities. The cash halance will be the amount required to "lum" the Autosave Case 8. Horniman Home Insert Draw Page Layout Formulas Data Review View Tell me Share Comments Calibet Body 11 - A A 29 % Paste BU Cardinal Formatting Formatas Table Cell Styles Tuber C Editing Ideas 034 - F 034 D Exhibit 1 panted to For 2 HORMAN HORTICULTURE Projected Hominan Horticulture and Surrearylin thousands of dollars) 2012 2013 2015 2016 Input AL 788.5 102 3555 3012 302.6 4155 3788 302.0 38.4 13.4 131 253 3052 1.04 4277 503.4 4705 5.45.4 3560 4045 36.3 40.9 782 100.0 25.2 392 50. 30 osoberan's forecast of revenue growth to 125 2015 tood/ Botante evento do 2015 rata 568. Apense/revenue 460 Maggie Browse fost: 129 Balance Grouprot A Direction 2015 affective as/op Balance Operations 50 17.5 32.6 520 120.1 90.6 Profit and loss statement Hovence Chist of sold 10 Groot 11 SC Apense 12 Depreciation 13 Ouerating prote 1 Tanes 15 Nit profit 1 lance sheet 10 Cash Accounts receivable 20 Inventory 21. Other currentes Current ICA) 22. Nette INFA 24 Totalanes 25 28 Accounts payable 27 Wile/WP) 28 Other payables OP 2 Current liabilities) 30 Lorem de 11 Newt 32 Total abilities net worth 20. 1993 3321 1.0320 105.2 99.5 507.6 19.3 7316 3325 1,0641 66 119.5 10.4 5234 22.6 20,9 7323 8136 30 347.9 1.11661181.5 PLUG Aternation of 2015 ratio non civile 2015 Inventory out a good sold 2015 rather cuntrance Sum CathInventory Other Calculate 2015 NIA 2016 apr 2016 degree XD Sum CANA 51 45 60 19.7 10.3 350 5.0 14.4 179 47.5 15.4 427 16.6 412 2015 at spille purch 2015 ratio was payable/cost of rods sold 2015 other plus APWP :OP som Maesthernet loan to the business Calcul 1015 net worth 2016 proft Sum CLNW 9961 1,012.0 1.0214 1.0601 1,0734 11142 1.116.6.2015 22.0 1601 654,0 45 1151 4 Capital expenditure 35 Purch 36 Net Working Capital 17 Exh 1 1452 68,0 1513 6891 75.0 Mbow's time footnote on 139 2015 to purch out of prods sold CAC Exh 2 + MI 100 er Format Tools AutoSave CT Home Insert Draw Page Layout Formulas Data Data Window Help Case 8_Horniman Review View Tell me Conditional Formatting Formatas Table Number Call Styles Share Comments Calibr (Body) 11 Es A % Paste B 1 U Cere Editing Ideas 034 034 A d V 1 N 0 0 750 Magnate footnote on p. 129 2015 ratio purch/cotofood Chovanda.a capital expenditure 22.0 3 R 85 4.5 30 Purchaves 140.8 1612 15. * Net Working Capital (WC) 6640 6889 6891 7863 Inventory investment was valued at the lower of cost or meet the cost investory was determined by cumulating the cost octed with preparing the plants for costs that were typically capitalas inventory included direct labor, material water continentale labels, chemical scrap Other current included consigned inventory.orderind 9. held for sale Nethemets included and, bulong and improvement, ent and aware Purchmessed the annual amount to wppliers NWAR O CANIA 2012 2013 2014 2015 2016 Cash Flow Estimates 15 Option li Cwh PLUG Operating profil 34 131 251 34 502 176 12.6 342 668 220 NA NA 782 26.2 530 162 4 couler Operating ProNOPAT . add back Depreciation 30 Operating Cash Flow 11 Capital pentru increase in WC Free Cash flow to Firm 1000 39.2 60. 40,9 1017 45 572 0.00 243 0.00 AB 1 02 0.00 55 Option 2 Cash Magle's goal Operating profit 5 less Tawe Net Operating ProfiNOPAT) Sandback: Depreciation 60 Operatin Cash Flow At le Capital Expenditures 62 less increase in WC 6 equals Free Cash How to Firm 502 17.6 32.6 342 66.8 22.0 NA NA 38,4 13. 25.1 38.4 637 782 262 52.0 36,3 883 81 0.2 0.00 1000 12 6. 40,9 1012 4.5 972 24.9 0.00 0.00 5 Exh 1 Exh 2 + AutoSave OFF Case 8_Horniman Home Insert Draw Page Layout Formulas Data Review View Tell me Calibri (Body) 11 29 ' a. Au % RII Conditional Formatting Format as Table Cell Styles Paste B Number L12 034 E G H 0 Exhibit 2 HORNIMAN HORTICULTURE Financial Ratio Analysis and Benchmarking 2 3 & 5 2012 2013 2014 2015 Benchmark 6 2.9% 2.4% 12.5% 15.5% 48.9% 46.9% 51.8% 52.0% 6.4% 4.8% 8.6% 9.5% 4.1% 3.1% 5.7% 5.8% (1.8% 48.9% 7.6% 2.8% 7 Revenue growth Gross margin (Gross profit/ Revenue) 0 Operating margin (Op. profit / Revenue) 10 Net profit margin (Net profit/Revenue) 11 12 Return on assets (Net profit / Total assets) 1a Return on capital (Net profit/Total capita 14 15 Receivable days (AR / Revenue 365) 16 Inventory days (Inventory/COGS365) 17 Payabledays (AP/Purchases - 365) 18 NFA turnover (Revenue/NFA) 3.2% 3.3% 2.4% 2.5% 4.7% 4.8% 5.1% 5.4% 2.9% 4.0% 41.9 424.2 15.6 24 45.0 432.1 13.3 2.4 48.0 50.9 436.5 476.3 10.2 9.9 2.4 3.0 21.8 386.3 26.9 2.7 10 20 'Benchmark figures are based on 2014 financial ratios of publicly traded horticulture producers 21 22 23 25 26 28 30 31 32 33 34 35 30 37 Exh 1 Exh 2 + This case illustrates the problems of cash flow and working-capital management that are typical for small, growing businesses. At the end of 2015, Bob and Maggie Brown have completed their third year of operating Horniman Horticulture (HH), a $1-million-revenue woody-shrub nursery in central Virginia. While experiencing strong demand and improved margins, the Browns are puzzled by their plummeting cash balance. The case highlights the difference between cash flow and accounting profits, as well as the common negative effects of growth on cash flow. It also motivates discussions about financial ratio analysis, the cash cycle, and working capital management; development of a financial model; and the relevance of free cash flow to business owners and managers. Study Questions 1. Case Exhibit 1 summarizes HH financial statements for the past four years and Case Exhibit 2 provides selected financial ratios. What is your assessment of the recent financial performance of the business? How do HH ratios compare with the benchmarks prepared by Maggie, based on average data for publicly-traded horticultural producers? (LO 4,5,6) 2. What explains the erosion of the cash balance? (LO 6) 3. Do you agree with Maggie Brown's accounts payable policy? Before you answer, be sure to consider the information in footnote 2 on page 128. (LO 6) 4. Let's anticipate the financial position of the business in the next year of operation. Extend the financial statements through 2016, assuming (1) the expected revenue growth is 30%, as predicted by Bob Brown on page 129; (2) Depreciation expense and capital expenditures are $46,000 and $75,000, respectively, as estimated by Maggie Brown in footnote 4 on page 129; and (3) the percent of sales approach provides a reasonable forecast of all operating expenses, all current assets (except cash) and all current liabilities. The cash halance will be the amount required to "lum" the Autosave Case 8. Horniman Home Insert Draw Page Layout Formulas Data Review View Tell me Share Comments Calibet Body 11 - A A 29 % Paste BU Cardinal Formatting Formatas Table Cell Styles Tuber C Editing Ideas 034 - F 034 D Exhibit 1 panted to For 2 HORMAN HORTICULTURE Projected Hominan Horticulture and Surrearylin thousands of dollars) 2012 2013 2015 2016 Input AL 788.5 102 3555 3012 302.6 4155 3788 302.0 38.4 13.4 131 253 3052 1.04 4277 503.4 4705 5.45.4 3560 4045 36.3 40.9 782 100.0 25.2 392 50. 30 osoberan's forecast of revenue growth to 125 2015 tood/ Botante evento do 2015 rata 568. Apense/revenue 460 Maggie Browse fost: 129 Balance Grouprot A Direction 2015 affective as/op Balance Operations 50 17.5 32.6 520 120.1 90.6 Profit and loss statement Hovence Chist of sold 10 Groot 11 SC Apense 12 Depreciation 13 Ouerating prote 1 Tanes 15 Nit profit 1 lance sheet 10 Cash Accounts receivable 20 Inventory 21. Other currentes Current ICA) 22. Nette INFA 24 Totalanes 25 28 Accounts payable 27 Wile/WP) 28 Other payables OP 2 Current liabilities) 30 Lorem de 11 Newt 32 Total abilities net worth 20. 1993 3321 1.0320 105.2 99.5 507.6 19.3 7316 3325 1,0641 66 119.5 10.4 5234 22.6 20,9 7323 8136 30 347.9 1.11661181.5 PLUG Aternation of 2015 ratio non civile 2015 Inventory out a good sold 2015 rather cuntrance Sum CathInventory Other Calculate 2015 NIA 2016 apr 2016 degree XD Sum CANA 51 45 60 19.7 10.3 350 5.0 14.4 179 47.5 15.4 427 16.6 412 2015 at spille purch 2015 ratio was payable/cost of rods sold 2015 other plus APWP :OP som Maesthernet loan to the business Calcul 1015 net worth 2016 proft Sum CLNW 9961 1,012.0 1.0214 1.0601 1,0734 11142 1.116.6.2015 22.0 1601 654,0 45 1151 4 Capital expenditure 35 Purch 36 Net Working Capital 17 Exh 1 1452 68,0 1513 6891 75.0 Mbow's time footnote on 139 2015 to purch out of prods sold CAC Exh 2 + MI 100 er Format Tools AutoSave CT Home Insert Draw Page Layout Formulas Data Data Window Help Case 8_Horniman Review View Tell me Conditional Formatting Formatas Table Number Call Styles Share Comments Calibr (Body) 11 Es A % Paste B 1 U Cere Editing Ideas 034 034 A d V 1 N 0 0 750 Magnate footnote on p. 129 2015 ratio purch/cotofood Chovanda.a capital expenditure 22.0 3 R 85 4.5 30 Purchaves 140.8 1612 15. * Net Working Capital (WC) 6640 6889 6891 7863 Inventory investment was valued at the lower of cost or meet the cost investory was determined by cumulating the cost octed with preparing the plants for costs that were typically capitalas inventory included direct labor, material water continentale labels, chemical scrap Other current included consigned inventory.orderind 9. held for sale Nethemets included and, bulong and improvement, ent and aware Purchmessed the annual amount to wppliers NWAR O CANIA 2012 2013 2014 2015 2016 Cash Flow Estimates 15 Option li Cwh PLUG Operating profil 34 131 251 34 502 176 12.6 342 668 220 NA NA 782 26.2 530 162 4 couler Operating ProNOPAT . add back Depreciation 30 Operating Cash Flow 11 Capital pentru increase in WC Free Cash flow to Firm 1000 39.2 60. 40,9 1017 45 572 0.00 243 0.00 AB 1 02 0.00 55 Option 2 Cash Magle's goal Operating profit 5 less Tawe Net Operating ProfiNOPAT) Sandback: Depreciation 60 Operatin Cash Flow At le Capital Expenditures 62 less increase in WC 6 equals Free Cash How to Firm 502 17.6 32.6 342 66.8 22.0 NA NA 38,4 13. 25.1 38.4 637 782 262 52.0 36,3 883 81 0.2 0.00 1000 12 6. 40,9 1012 4.5 972 24.9 0.00 0.00 5 Exh 1 Exh 2 + AutoSave OFF Case 8_Horniman Home Insert Draw Page Layout Formulas Data Review View Tell me Calibri (Body) 11 29 ' a. Au % RII Conditional Formatting Format as Table Cell Styles Paste B Number L12 034 E G H 0 Exhibit 2 HORNIMAN HORTICULTURE Financial Ratio Analysis and Benchmarking 2 3 & 5 2012 2013 2014 2015 Benchmark 6 2.9% 2.4% 12.5% 15.5% 48.9% 46.9% 51.8% 52.0% 6.4% 4.8% 8.6% 9.5% 4.1% 3.1% 5.7% 5.8% (1.8% 48.9% 7.6% 2.8% 7 Revenue growth Gross margin (Gross profit/ Revenue) 0 Operating margin (Op. profit / Revenue) 10 Net profit margin (Net profit/Revenue) 11 12 Return on assets (Net profit / Total assets) 1a Return on capital (Net profit/Total capita 14 15 Receivable days (AR / Revenue 365) 16 Inventory days (Inventory/COGS365) 17 Payabledays (AP/Purchases - 365) 18 NFA turnover (Revenue/NFA) 3.2% 3.3% 2.4% 2.5% 4.7% 4.8% 5.1% 5.4% 2.9% 4.0% 41.9 424.2 15.6 24 45.0 432.1 13.3 2.4 48.0 50.9 436.5 476.3 10.2 9.9 2.4 3.0 21.8 386.3 26.9 2.7 10 20 'Benchmark figures are based on 2014 financial ratios of publicly traded horticulture producers 21 22 23 25 26 28 30 31 32 33 34 35 30 37 Exh 1 Exh 2 +
