Answered step by step
Verified Expert Solution
Link Copied!

Question

1 Approved Answer

This chart represents the relationship between money spent on marketing/advertising and the number of sales. 250 500 Soo Advert Which of the following describes the
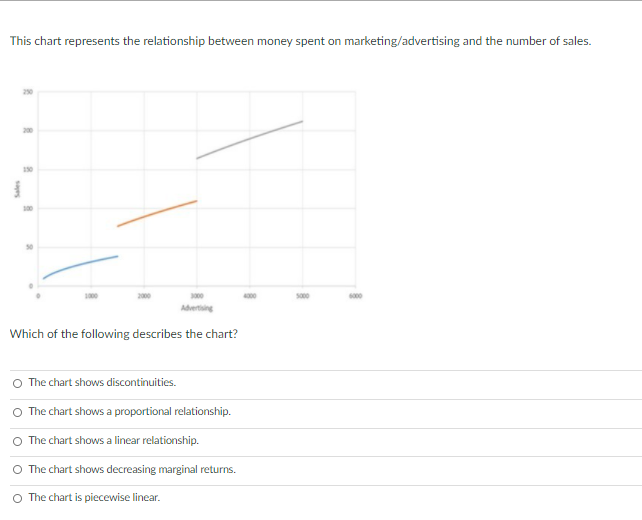
image text in transcribed

This chart represents the relationship between money spent on marketing/advertising and the number of sales. 250 500 Soo Advert Which of the following describes the chart? The chart shows discontinuities. The chart shows a proportional relationship. The chart shows a linear relationship. The chart shows decreasing marginal returns. The chart is piecewise linear

Step by Step Solution

There are 3 Steps involved in it

Step: 1

blur-text-image

Get Instant Access to Expert-Tailored Solutions

See step-by-step solutions with expert insights and AI powered tools for academic success

Step: 2

blur-text-image

Step: 3

blur-text-image

Ace Your Homework with AI

Get the answers you need in no time with our AI-driven, step-by-step assistance

Get Started

Recommended Textbook for

Mein Ultimativer Weihnachts Planer

Authors: Zizo Nimane

1st Edition

B0CM2J8GTG

More Books

Students also viewed these Finance questions