Question
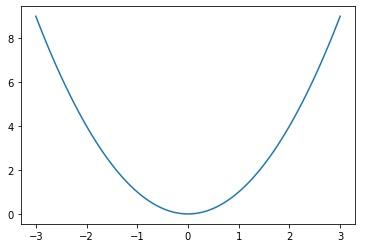
This code for Gradient Descent algorithm for one vector x and I attached the image of plots of the algorithm after run I want to
This code for Gradient Descent algorithm for one vector x and I attached the image of plots of the algorithm after run
I want to update the same code for two vectors (two Dimensions) with plots them """""""""""""""""""""""""""""""""""""""""""""""""""""""""""""""""""""""""""""""""""""""""""""""""""
import numpy as np from matplotlib import pyplot as plt class GradientDescent: def __init__(self, function, gradient, initial_solution, learning_rate=0.1, max_iter=100, tolerance=0.0000001): self.function = function self.gradient= gradient self.solution = initial_solution self.learning_rate = learning_rate self.max_iter = max_iter self.tolerance = tolerance def run(self): t = 0 while t
def gradient1(x,y): return 2*x
bounds = [-3,3]
plt.figure()
x = np.linspace(bounds[0], bounds[1],100) plt.plot(x,fun1(x))
random_solution = np.random.uniform(bounds[0], bounds[1])
gd = GradientDescent(fun1, gradient1, random_solution)
best_solution,best_value = gd.run()

Step by Step Solution
There are 3 Steps involved in it
Step: 1

Get Instant Access to Expert-Tailored Solutions
See step-by-step solutions with expert insights and AI powered tools for academic success
Step: 2

Step: 3

Ace Your Homework with AI
Get the answers you need in no time with our AI-driven, step-by-step assistance
Get Started


