this course is Data analysis for business analytics for MSc Information Systems. i have attached a screenshot of the excell link in the case study.
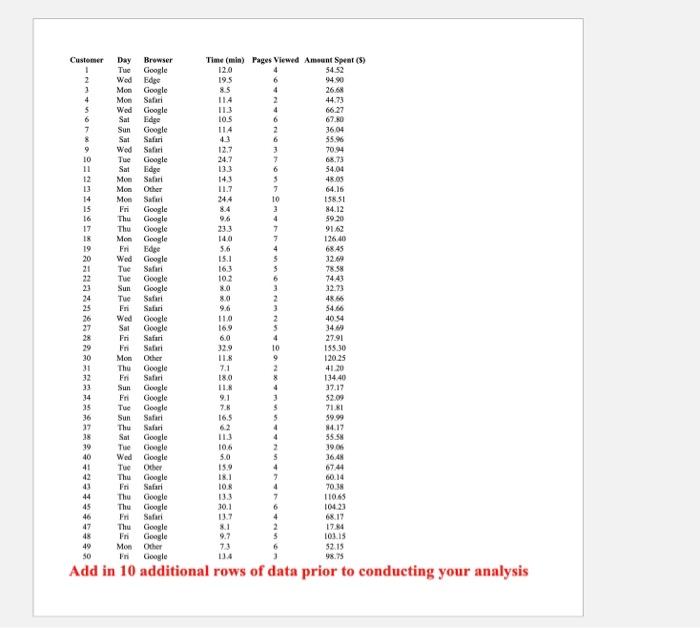
please add in 10 additional rows of data prior to conducting the analysis; this is very important
The student will be provided with Case Studies (or similar exercises) related to the current readings during Units 1 through 8 of the course. After reading the relevant cases (or similar exercises), as a minimum, the student will write answers to all questions following the required case and submit them by 11:59 p.m. Sunday CT. Case studies should be formatted according to APA guidelines for an executive summary. Case Study Parkville Candies manufactures and sells quality candy products at its plant and retail store located in Parkville, Missouri. Five years ago, the company developed a web site and began selling its products over the Internet. Web site sales have exceeded the company's expectations, and management is now considering strategies to increase sales even further. To learn more about the web site customers, a sample of 50 transactions was selected from the previous month's sales. Data showing the day of the week each transaction was made, the type of browser the customer used, the time spent on the web site, the number of wers pages viewed, and the amount spent by each of the 50 customers are contained in a file called First Quarter Candy Sales. A portion of the data is shown in the attached Table. - Final Parkville Candies (Excel file) Minimize File Preview Respond in detail to each question with at least 1-2 summary paragraph. Review the rubric prior to responding. Parkville Candies would like to use the sample data to determine whether online shoppers who spend more time and view more pages also spend more money during their visit to the web site. The company would also like to investigate the effect that the day of the week and the type of browser have on sales. managerial Report Use the methods of descriptive statistics to learn about the customers who visit the Parkville Candies web site. Include the following in your report. 1. Add an additional 10 rows of data to the existing table prior to your analysis. Using the Graphical and numerical summaries for the length of time the shopper spends on the web site, the number of pages viewed, and the mean amount spent per trans-action. Discuss what you learn about Parkville Candies' online shoppers from these numerical summaries. - Note, You will include the data table as an upload to the assignment. The purpose of adding the additional data roles is to ensure academic integrity and to provide you with the opportunity to have unique sets of data. 2. Summarize the frequency, the total dollars spent, and the mean amount spent per transaction for each day of week. Discuss the observations you can make about Parkville Candies' business based on the day of the week? 3. Summarize the frequency, the total dollars spent, and the mean amount spent per transaction for each type of browser. Discuss the observations you can make about Parkville Candies' business based on the type of browser? 4. Develop a scatter chart, and compute the sample correlation coefficient to explore the relationship between the time spent on the web site and the dollar amount spent. Use the horizontal axis for the time spent on the web site. Discuss your findings. 5. Develop a scatter chart, and compute the sample correlation coefficient to explore the relationship between the number of web pages viewed and the amount spent. Use the horizontal axis for the number of web pages viewed. Discuss your findings. 6. Develop a scatter chart, and compute the sample correlation coefficient to explore the relationship between the time spent on the web site and the number of pages viewed. Use the horizontal axis to represent the number of pages viewed. onducting your analysis