Answered step by step
Verified Expert Solution
Question
1 Approved Answer
This exercise will be using the [Airbnb dataset] (http://insideairbnb.com/get-the-data.html) for NYC called 'listings.csv'. You can download it directly [here] (http://data.insideairbnb. com/united-statesyew-york-city/2022-12-04/visualisations/listings.csv) g) For all listings
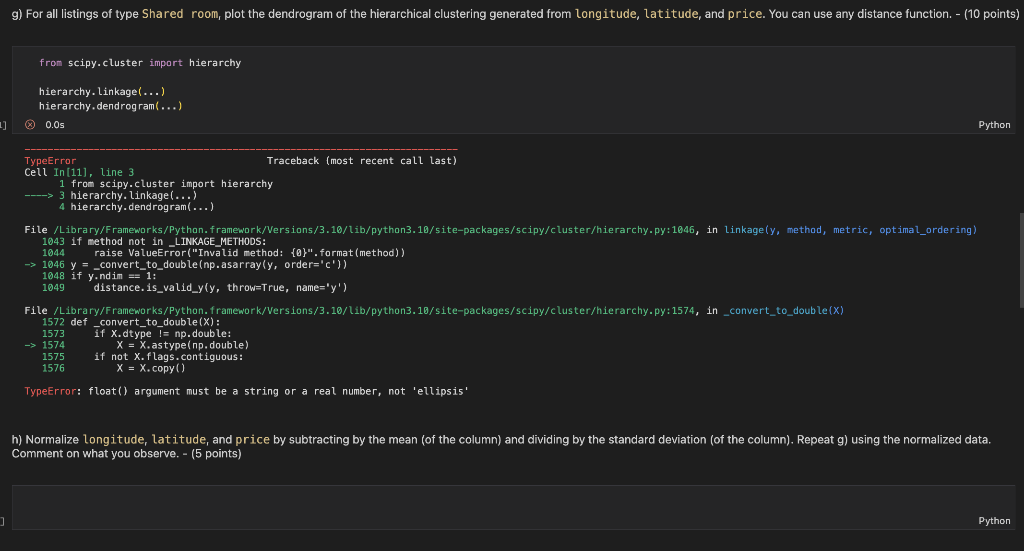
This exercise will be using the [Airbnb dataset] (http://insideairbnb.com/get-the-data.html) for NYC called 'listings.csv'. You can download it directly [here] (http://data.insideairbnb. com/united-statesyew-york-city/2022-12-04/visualisations/listings.csv) g) For all listings of type Shared room, plot the dendrogram of the hierarchical clustering generated from longitude, latitude, and price. You can use any distance function. - (10 points from scipy. cluster impart hierarchy hierarchy. Linkage(...) hierarchy, dendrogram(...) 0.0s Python h) Normalize longitude, latitude, and price by subtracting by the mean (of the column) and dividing by the standard deviation (of the column). Repeat g) using the normalized data. Comment on what you observe. - (5 points)
Step by Step Solution
There are 3 Steps involved in it
Step: 1
Get Instant Access to Expert-Tailored Solutions
See step-by-step solutions with expert insights and AI powered tools for academic success
Step: 2
Step: 3
Ace Your Homework with AI
Get the answers you need in no time with our AI-driven, step-by-step assistance
Get Started