Answered step by step
Verified Expert Solution
Question
1 Approved Answer
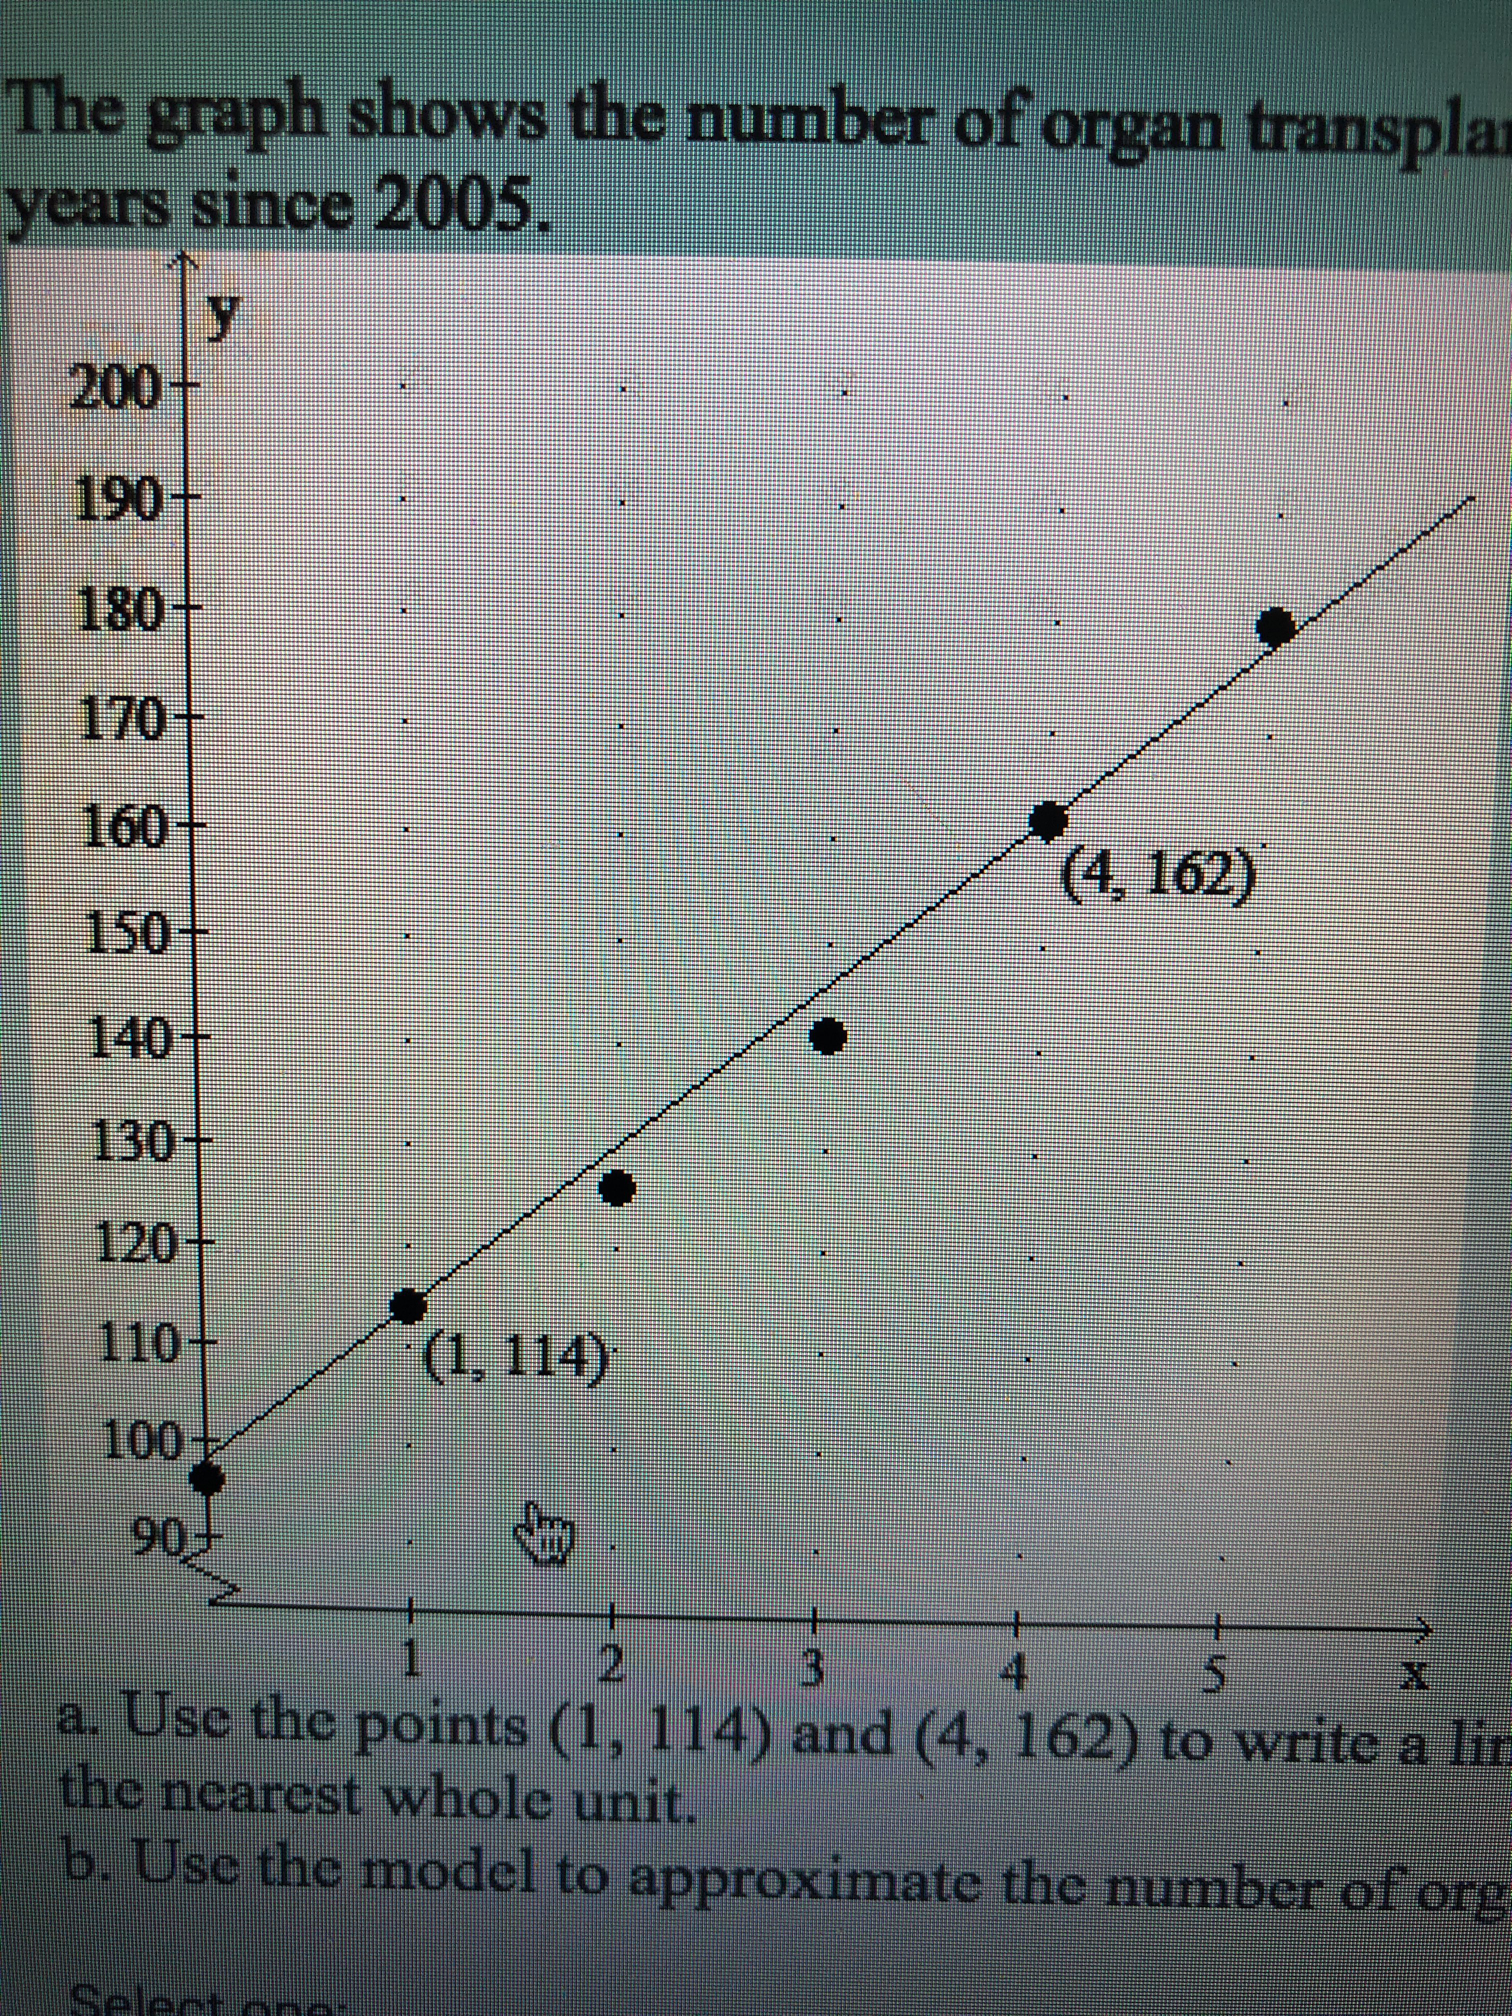
This graph shows the number y for the years 2005-2010 where x represents the number of years since 2005. Use the points (1,114) and (4,162)
This graph shows the number y for the years 2005-2010 where x represents the number of years since 2005. Use the points (1,114) and (4,162) to write a linear model for the data. Round the slope to one decimal place and y intercept to the nearest whole. Use the model to approximate the number performed in 2012.

Step by Step Solution
There are 3 Steps involved in it
Step: 1

Get Instant Access to Expert-Tailored Solutions
See step-by-step solutions with expert insights and AI powered tools for academic success
Step: 2

Step: 3

Ace Your Homework with AI
Get the answers you need in no time with our AI-driven, step-by-step assistance
Get Started


