

Answered step by step
Verified Expert Solution
Question
1 Approved Answer
This imput table is NOT assessed. It supports the analysis of the case on Bell Technology: Capital Structure, Valuation, and Cost of Capital Corporate
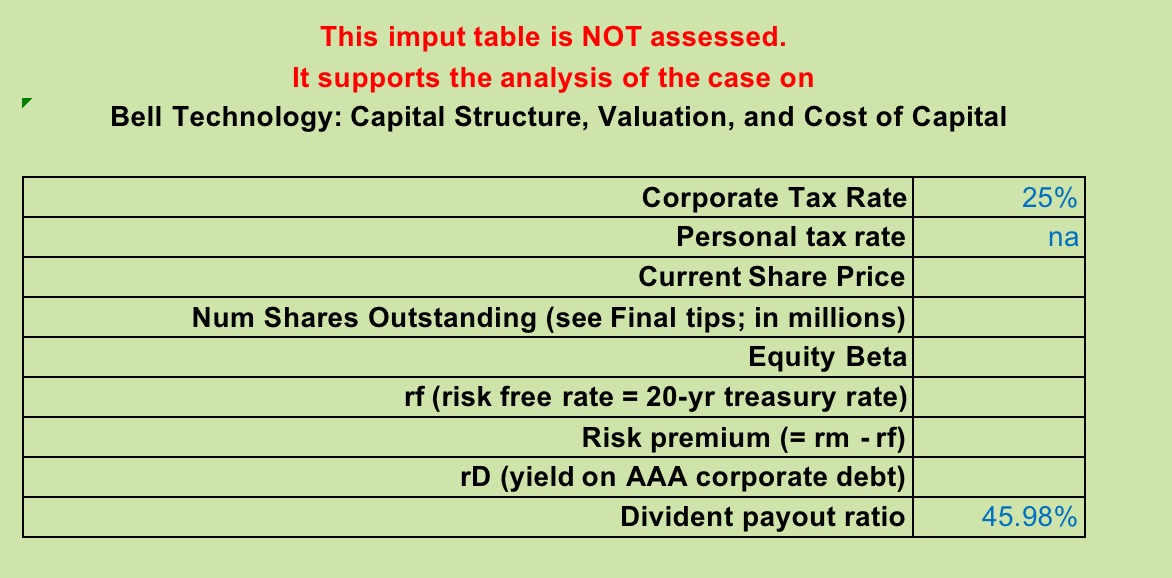
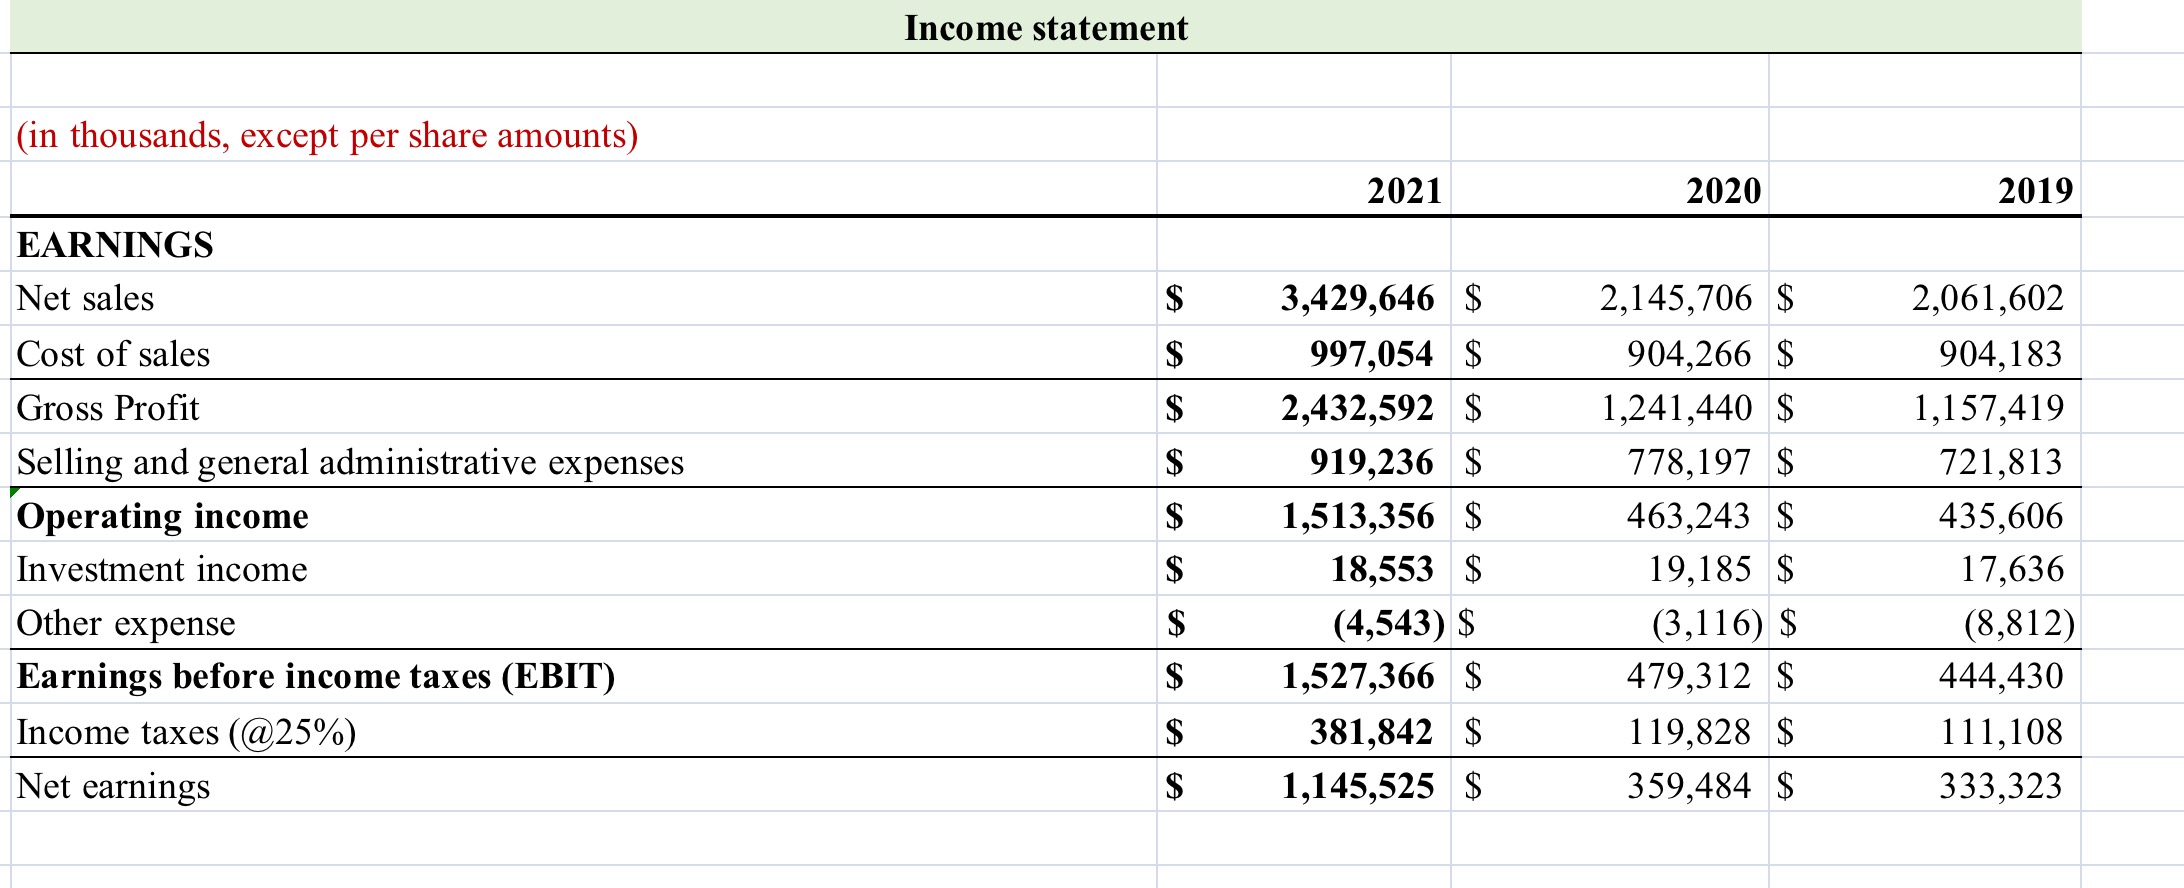
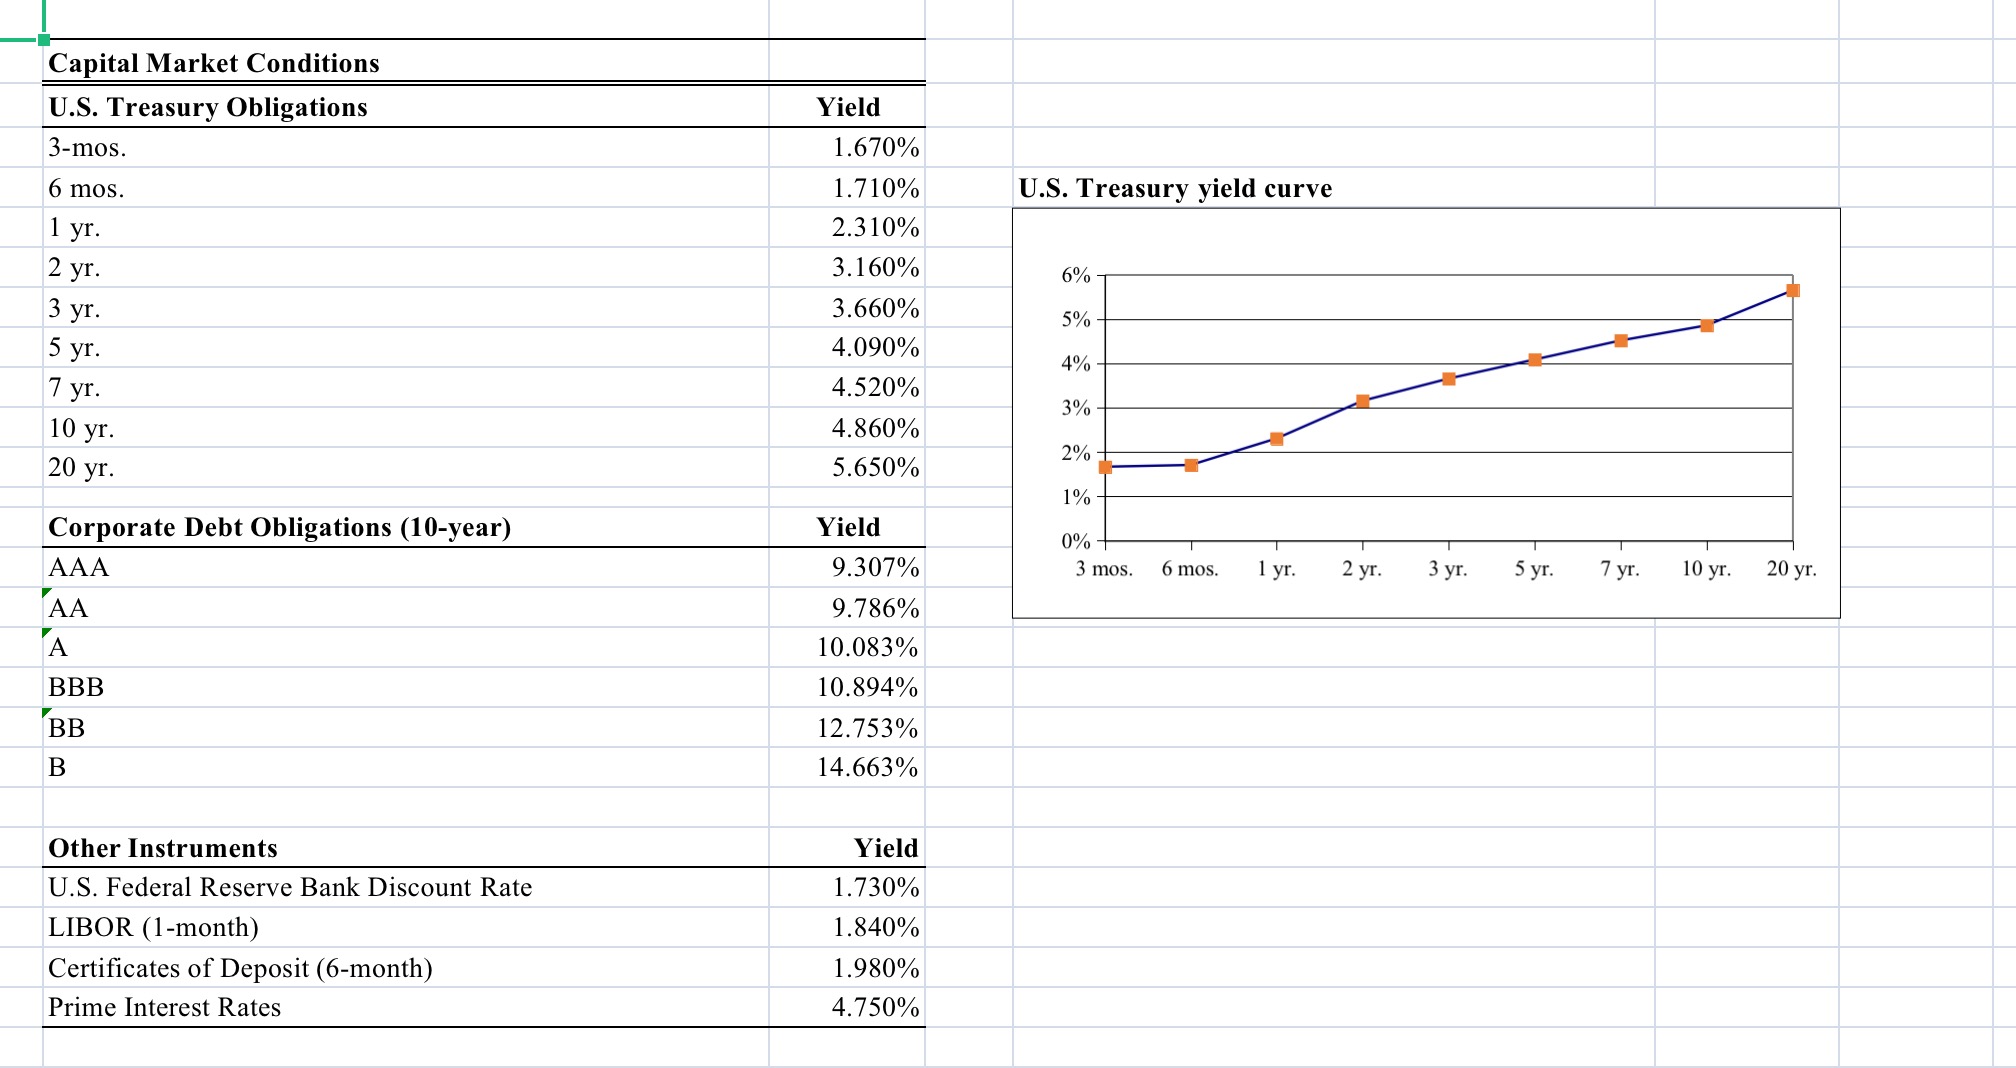
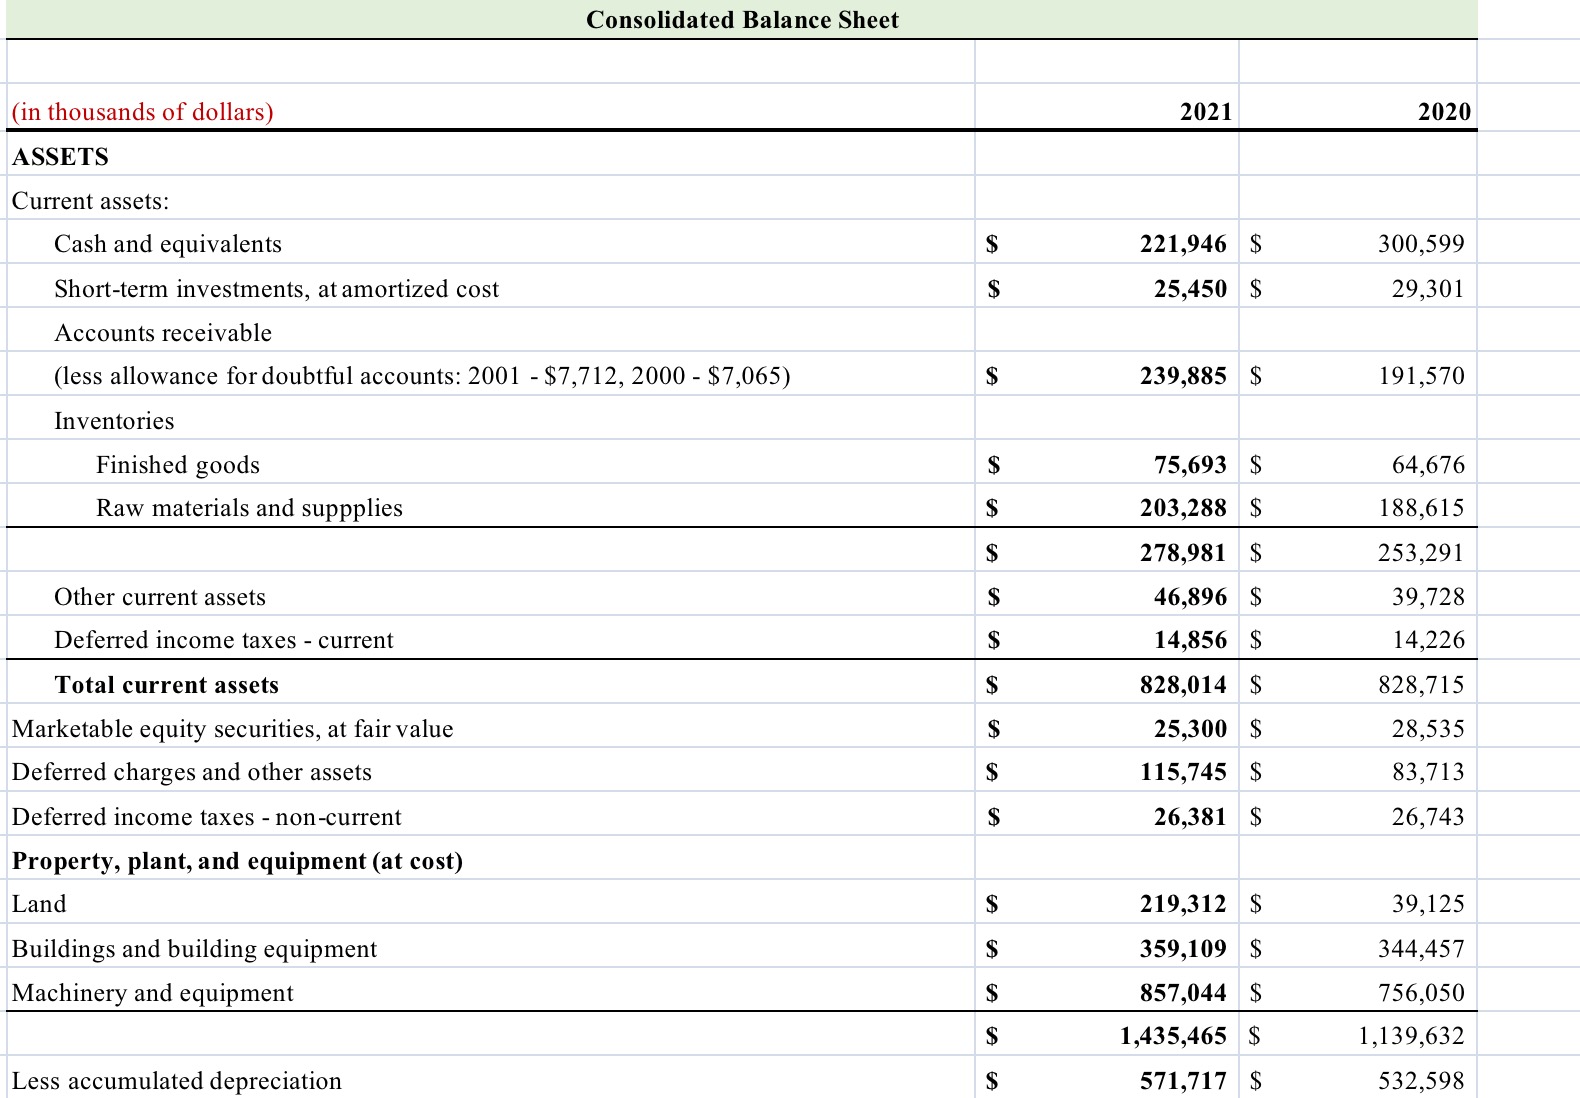
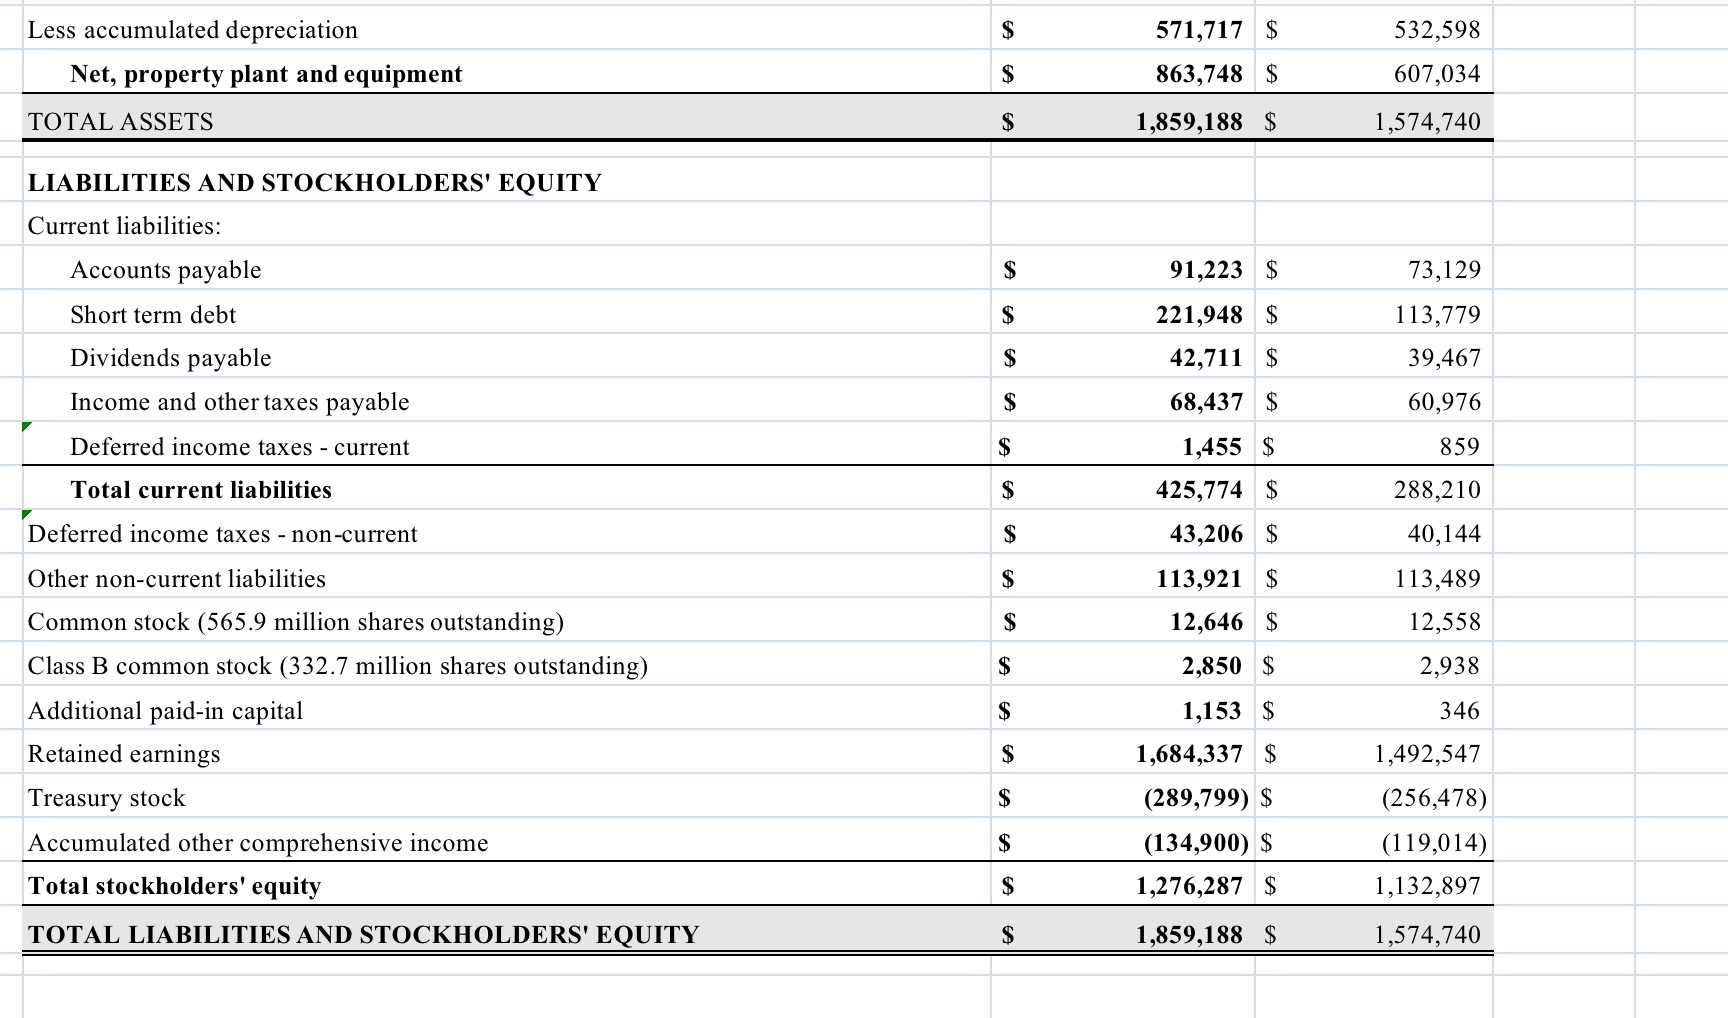
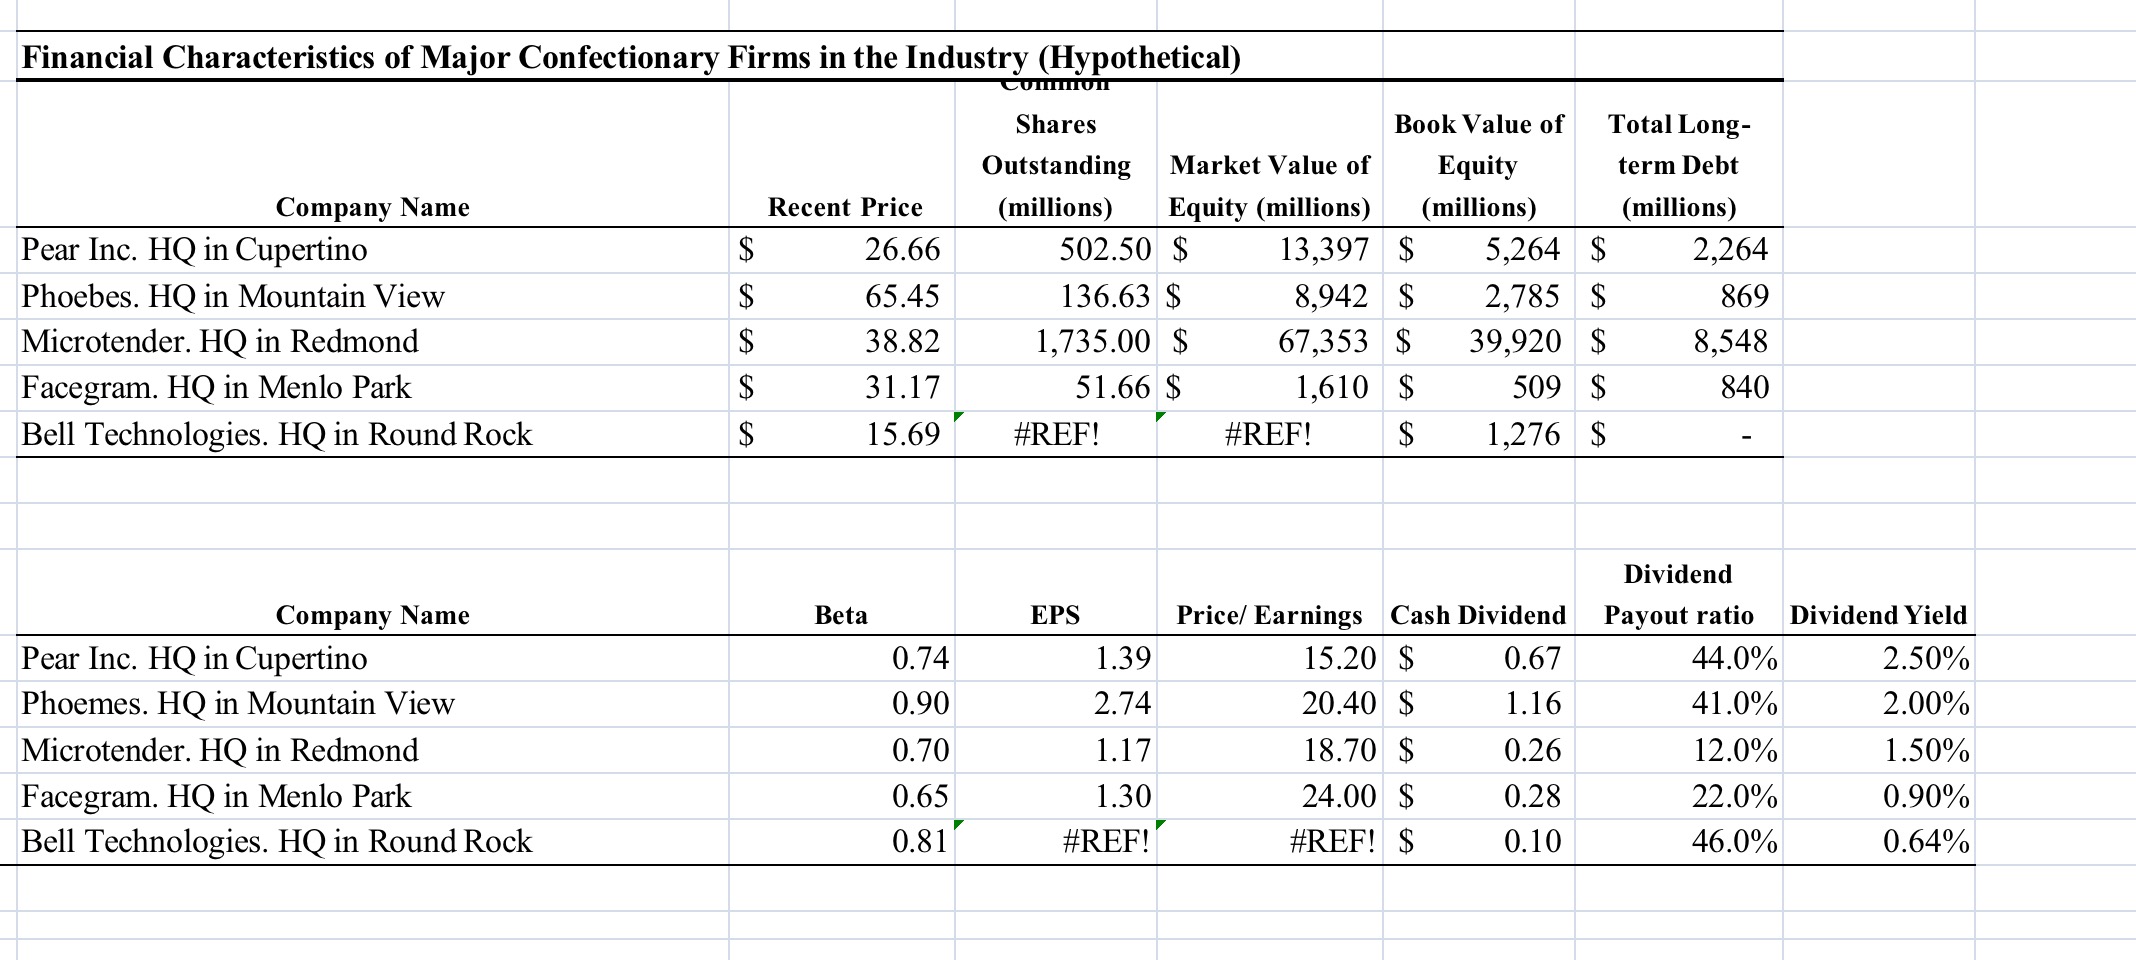
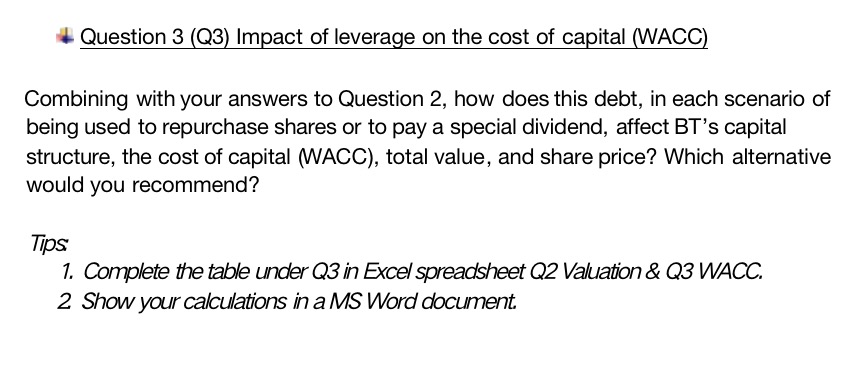
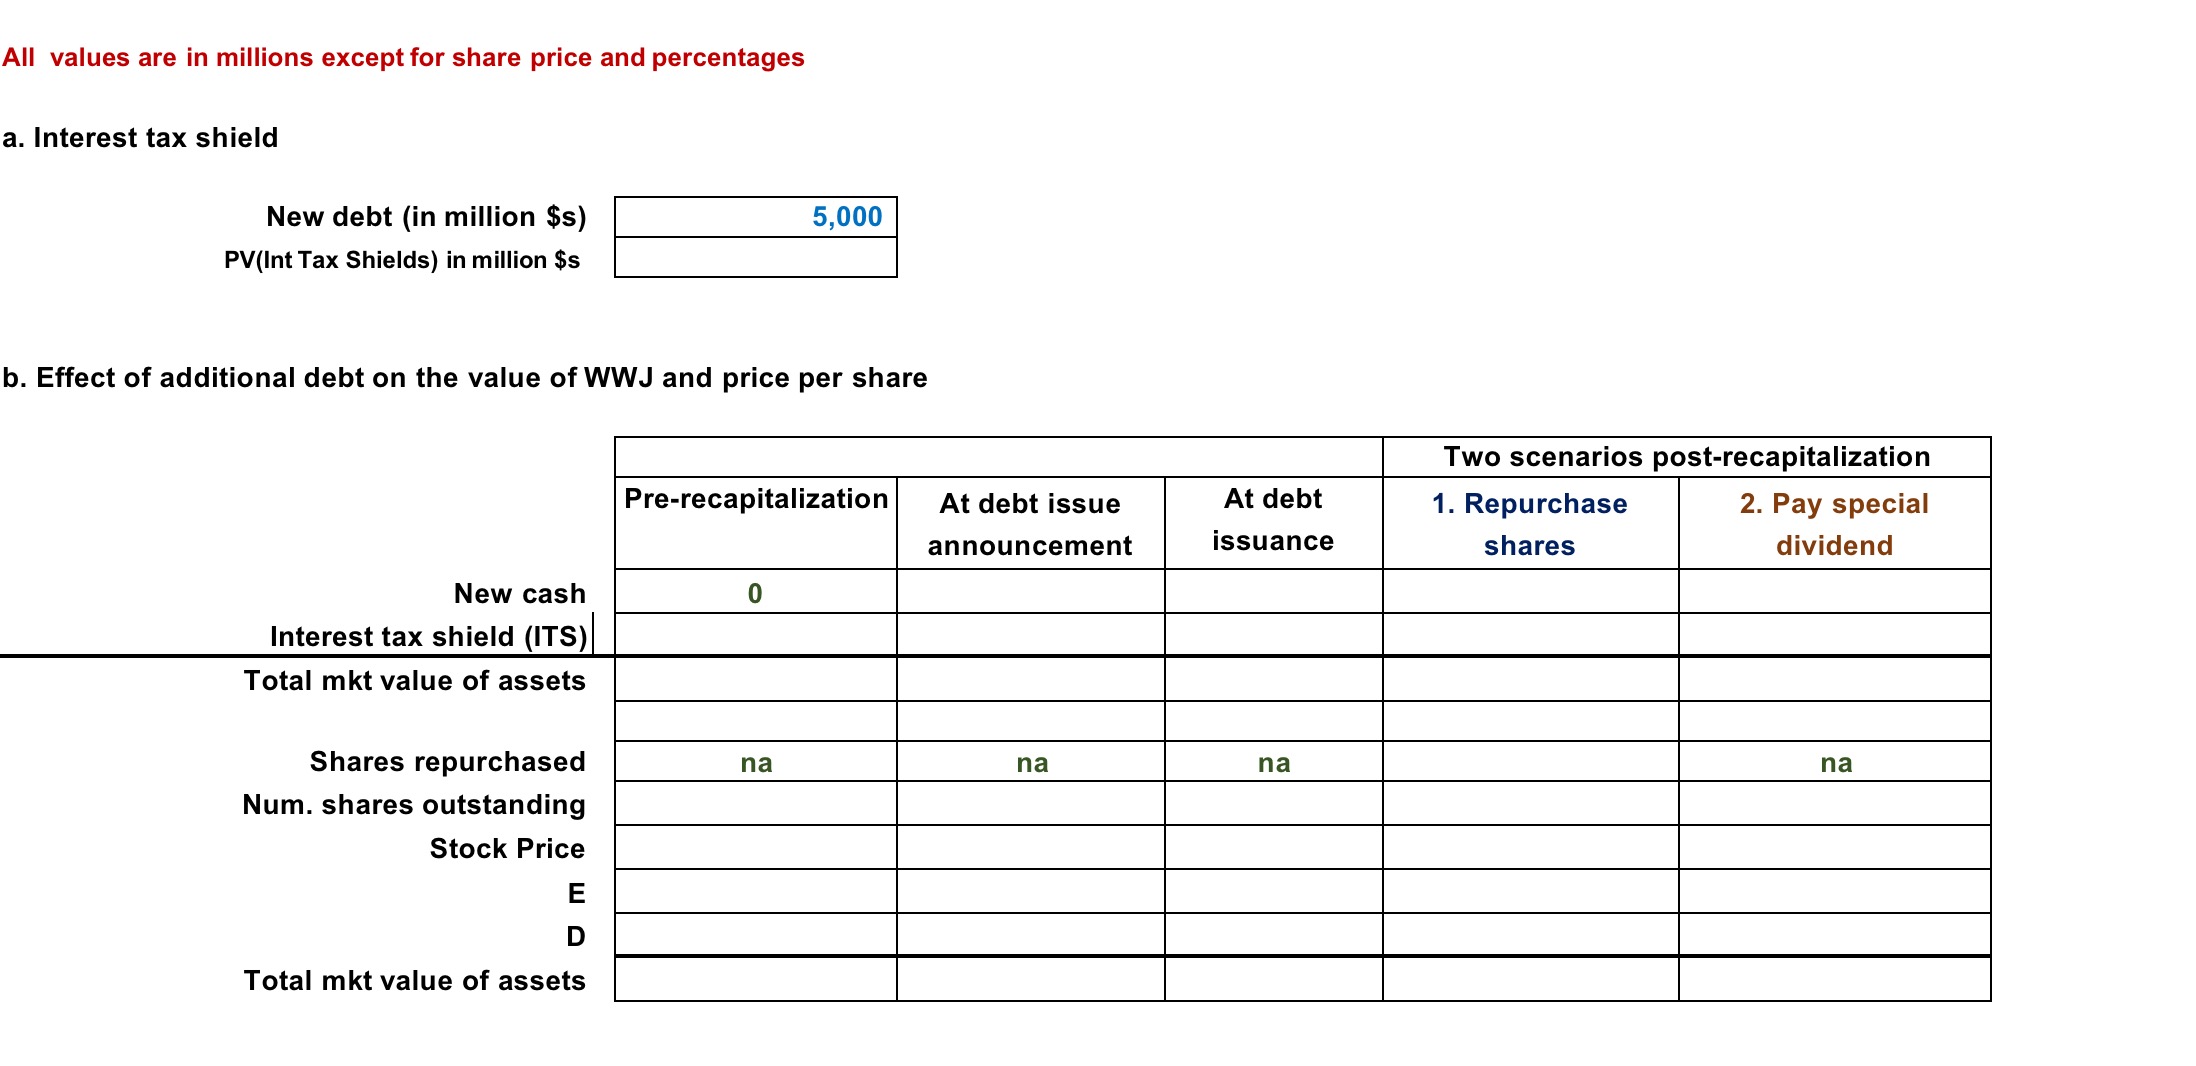
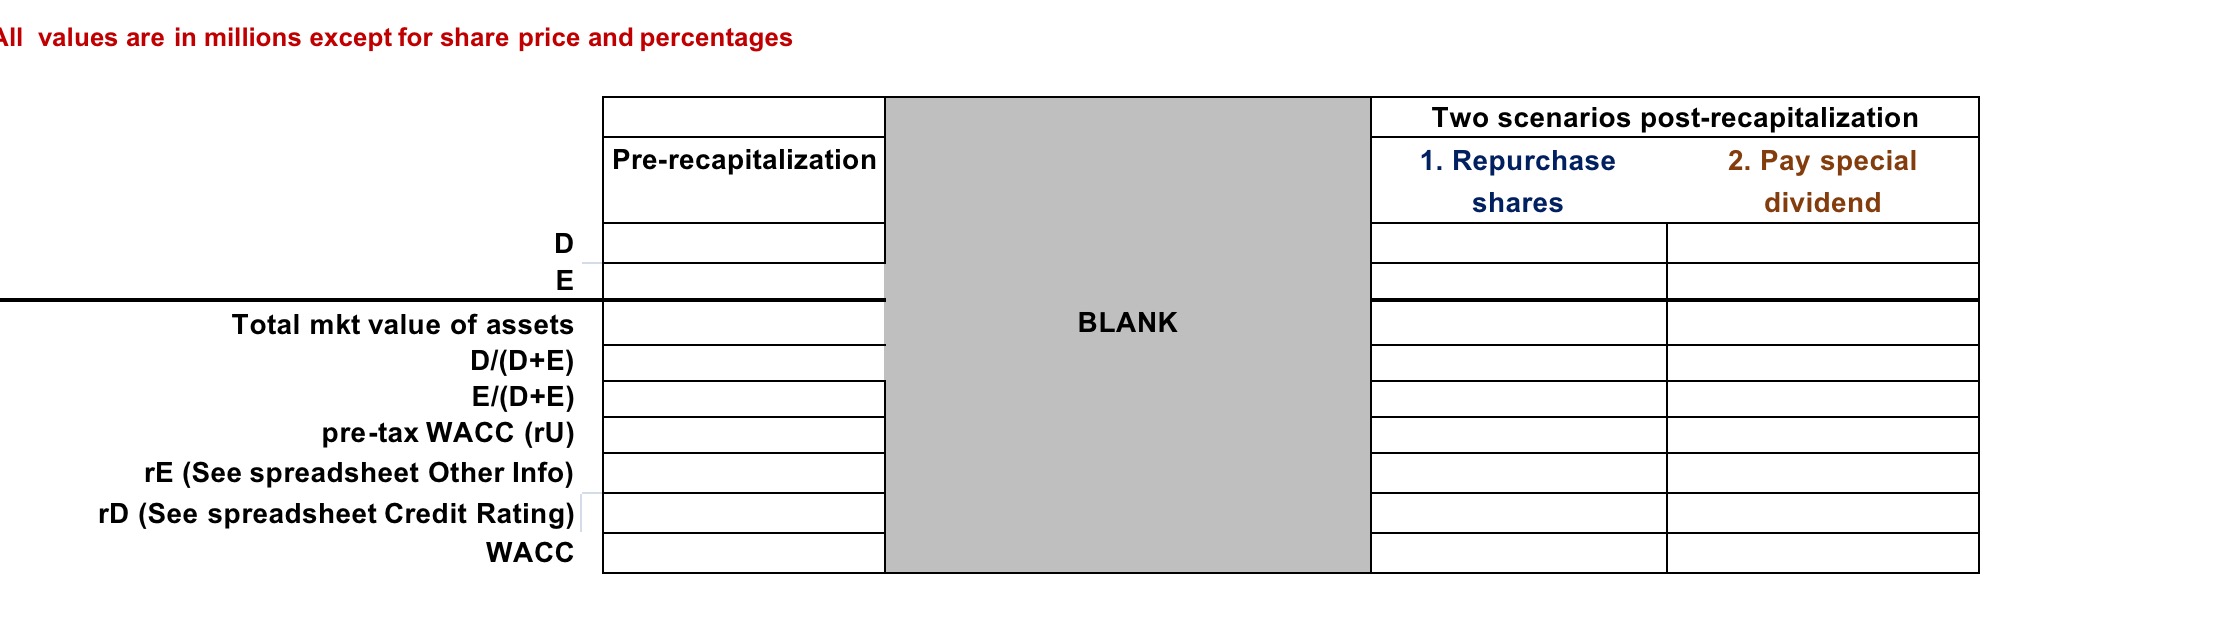
This imput table is NOT assessed. It supports the analysis of the case on Bell Technology: Capital Structure, Valuation, and Cost of Capital Corporate Tax Rate Personal tax rate Current Share Price Num Shares Outstanding (see Final tips; in millions) Equity Beta rf (risk free rate = 20-yr treasury rate) Risk premium (= rm -rf) rD (yield on AAA corporate debt) Divident payout ratio 25% na 45.98% (in thousands, except per share amounts) EARNINGS Net sales Cost of sales Gross Profit Selling and general administrative expenses Operating income Investment income Other expense Earnings before income taxes (EBIT) Income taxes (@25%) Net earnings Income statement $ $ $ $ $ $ $ $ $ $ 2021 3,429,646 $ 997,054 $ 2,432,592 $ 919,236 $ 1,513,356 $ 18,553 $ (4,543) $ 1,527,366 $ 381,842 $ 1,145,525 $ 2020 2,145,706 $ 904,266 $ 1,241,440 $ 778,197 $ 463,243 $ 19,185 $ (3,116) $ 479,312 $ 119,828 $ 359,484 $ 2019 2,061,602 904,183 1,157,419 721,813 435,606 17,636 (8,812) 444,430 111,108 333,323 Capital Market Conditions U.S. Treasury Obligations 3-mos. 6 mos. 1 yr. 2 yr. 3 yr. 5 yr. 7 yr. 10 yr. 20 yr. Corporate Debt Obligations (10-year) AAA AA A BBB BB B Other Instruments U.S. Federal Reserve Bank Discount Rate LIBOR (1-month) Certificates of Deposit (6-month) Prime Interest Rates Yield 1.670% 1.710% 2.310% 3.160% 3.660% 4.090% 4.520% 4.860% 5.650% Yield 9.307% 9.786% 10.083% 10.894% 12.753% 14.663% Yield 1.730% 1.840% 1.980% 4.750% U.S. Treasury yield curve 6% 5% 4% 3% 2% 1% 0% 3 mos. 6 mos. 1 yr. 2 yr. 3 yr. 5 yr. 7 yr. 10 yr. 20 yr. (in thousands of dollars) ASSETS Current assets: Cash and equivalents Short-term investments, at amortized cost Accounts receivable (less allowance for doubtful accounts: 2001 - $7,712, 2000 - $7,065) Inventories Finished goods Raw materials and suppplies Other current assets Deferred income taxes - current Total current assets Marketable equity securities, at fair value Deferred charges and other assets Deferred income taxes - non-current Property, plant, and equipment (at cost) Land Buildings and building equipment Machinery and equipment Consolidated Balance Sheet Less accumulated depreciation $ $ $ $ $ $ $ $ $ $ $ $ $ $ 2021 221,946 $ 25,450 $ 239,885 $ 75,693 $ 203,288 $ 278,981 $ 46,896 $ 14,856 $ 828,014 $ 25,300 $ 115,745 $ 26,381 $ 219,312 $ 359,109 $ 857,044 $ 1,435,465 $ 571,717 $ 2020 300,599 29,301 191,570 64,676 188,615 253,291 39,728 14,226 828,715 28,535 83,713 26,743 39,125 344,457 756,050 1,139,632 532,598 Less accumulated depreciation Net, property plant and equipment TOTAL ASSETS LIABILITIES AND STOCKHOLDERS' EQUITY Current liabilities: Accounts payable Short term debt Dividends payable Income and other taxes payable Deferred income taxes - current Total current liabilities Deferred income taxes - non-current Other non-current liabilities Common stock (565.9 million shares outstanding) Class B common stock (332.7 million shares outstanding) Additional paid-in capital Retained earnings Treasury stock Accumulated other comprehensive income Total stockholders' equity TOTAL LIABILITIES AND STOCKHOLDERS' EQUITY $ $ $ $ $ $ $ $ $ $ $ $ $ $ $ $ $ $ $ 571,717 $ 863,748 $ 1,859,188 $ 91,223 $ 221,948 $ 42,711 $ 68,437 $ 1,455 $ 425,774 $ 43,206 $ 113,921 $ 12,646 $ 2,850 $ 1,153 $ 1,684,337 $ (289,799) $ (134,900) $ 1,276,287 $ 1,859,188 $ 532,598 607,034 1,574,740 73,129 113,779 39,467 60,976 859 288,210 40,144 113,489 12,558 2,938 346 1,492,547 (256,478) (119,014) 1,132,897 1,574,740 Financial Characteristics of Major Confectionary Firms in the Industry (Hypothetical) Company Name Pear Inc. HQ in Cupertino Phoebes. HQ in Mountain View Microtender. HQ in Redmond Facegram. HQ in Menlo Park Bell Technologies. HQ in Round Rock Company Name Pear Inc. HQ in Cupertino Phoemes. HQ in Mountain View Microtender. HQ in Redmond Facegram. HQ in Menlo Park Bell Technologies. HQ in Round Rock $ $ $ $ $ Recent Price 26.66 65.45 38.82 31.17 15.69 Beta 0.74 0.90 0.70 0.65 0.81 CommoUIT Shares Outstanding Market Value of (millions) Equity (millions) 502.50 $ 136.63 $ 1,735.00 $ 51.66 $ #REF! EPS 1.39 2.74 1.17 1.30 #REF! Book Value of Equity (millions) 13,397 $ 8,942 $ 67,353 $ 1,610 $ $ #REF! 5,264 $ 2,785 $ 39,920 $ 509 $ 1,276 $ Price/ Earnings Cash Dividend 15.20 $ 20.40 $ 18.70 $ 24.00 $ #REF! $ Total Long- term Debt 0.67 1.16 0.26 0.28 0.10 (millions) 2,264 869 8,548 840 Dividend Payout ratio 44.0% 41.0% 12.0% 22.0% 46.0% Dividend Yield 2.50% 2.00% 1.50% 0.90% 0.64% Question 3 (Q3) Impact of leverage on the cost of capital (WACC) Combining with your answers to Question 2, how does this debt, in each scenario of being used to repurchase shares or to pay a special dividend, affect BT's capital structure, the cost of capital (WACC), total value, and share price? Which alternative would you recommend? Tips: 1. Complete the table under Q3 in Excel spreadsheet Q2 Valuation & Q3 WACC. 2 Show your calculations in a MS Word document. All values are in millions except for share price and percentages a. Interest tax shield New debt (in million $s) PV(Int Tax Shields) in million $s b. Effect of additional debt on the value of WWJ and price per share New cash Interest tax shield (ITS) Total mkt value of assets Shares repurchased Num. shares outstanding Stock Price E D Total mkt value of assets 5,000 Pre-recapitalization 0 na At debt issue announcement na At debt issuance na Two scenarios post-recapitalization 2. Pay special dividend 1. Repurchase shares na All values are in millions except for share price and percentages D E Total mkt value of assets D/(D+E) E/(D+E) pre-tax WACC (rU) rE (See spreadsheet Other Info) rD (See spreadsheet Credit Rating) WACC Pre-recapitalization BLANK Two scenarios post-recapitalization 1. Repurchase 2. Pay special shares dividend
Step by Step Solution
★★★★★
3.38 Rating (151 Votes )
There are 3 Steps involved in it
Step: 1
Impact of Leverage on the Cost of Capital WACC This analysis explores the impact of debt on Bell Technologies BT capital structure cost of capital WAC...
Get Instant Access to Expert-Tailored Solutions
See step-by-step solutions with expert insights and AI powered tools for academic success
Step: 2

Step: 3
Ace Your Homework with AI
Get the answers you need in no time with our AI-driven, step-by-step assistance
Get Started
Income Tax Fundamentals 2013
Authors: Gerald E. Whittenburg, Martha Altus Buller, Steven L Gill
31st Edition
1111972516, 978-1285586618, 1285586611, 978-1285613109, 978-1111972516