This in excel

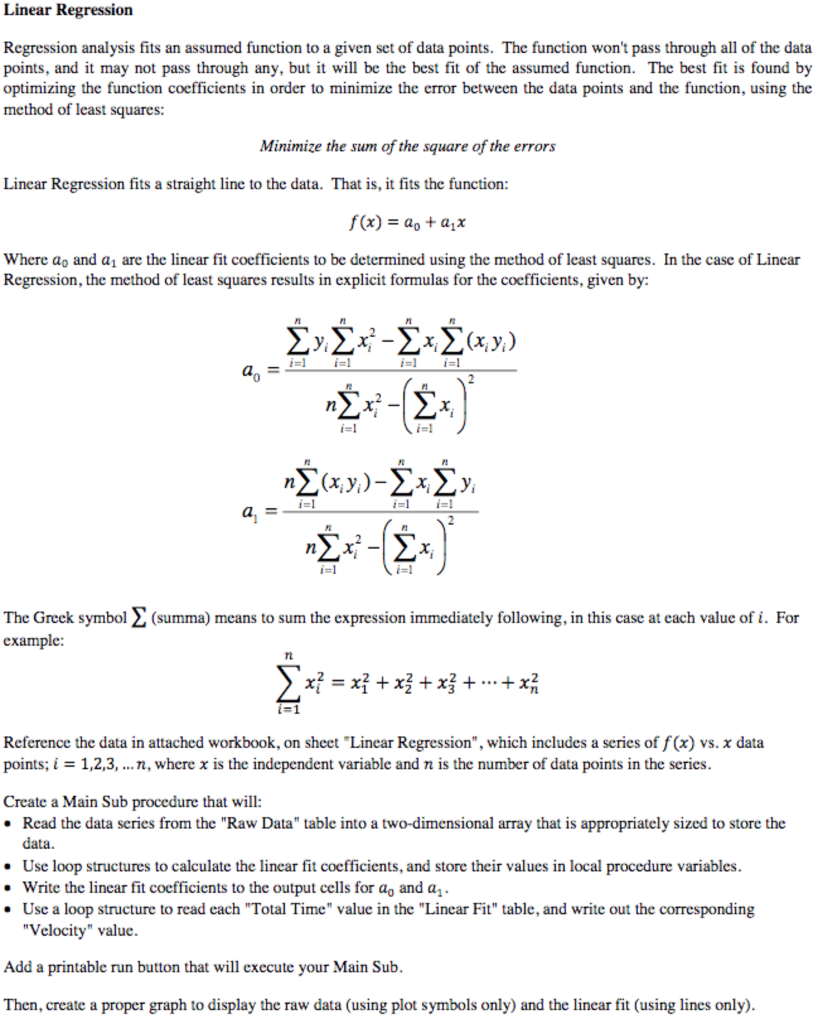
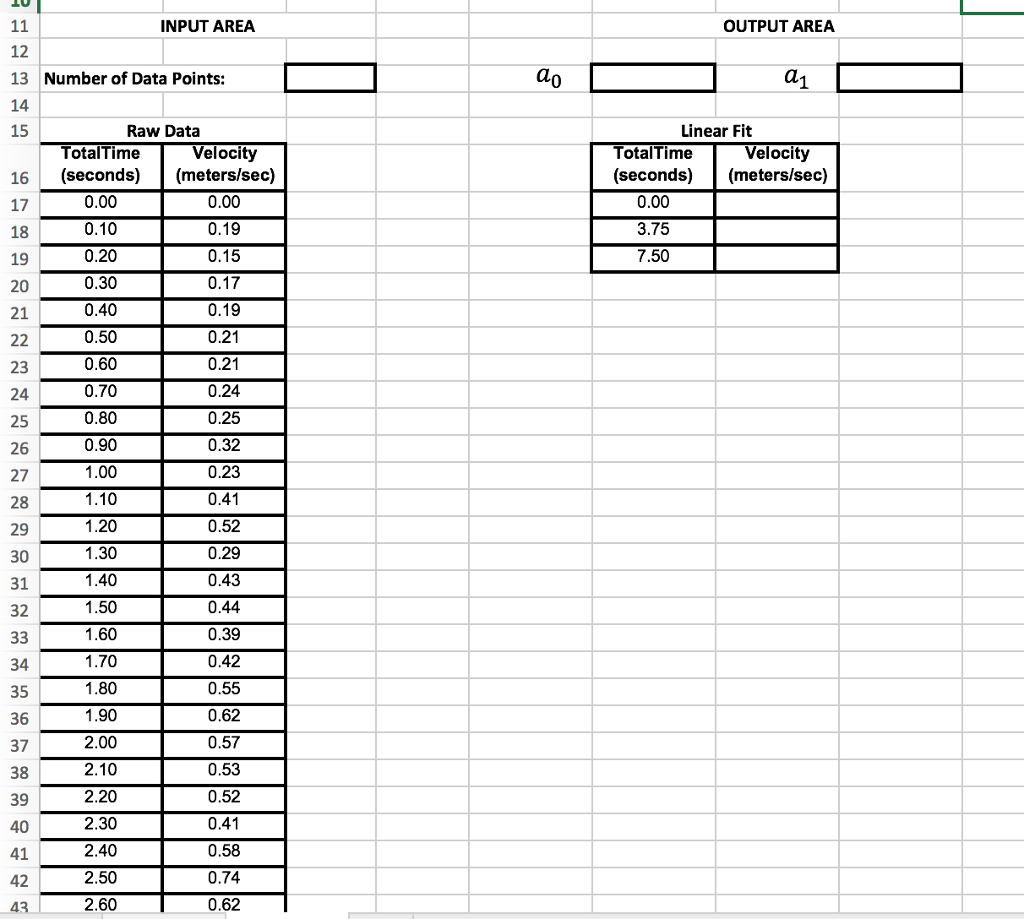
Linear Regression Regression analysis fits an assumed function to a given set of data points. The function won't pass through all of the data points, and it may not pass through any, but it will be the best fit of the assumed function. The best fit is found by optimizing the function coefficients in order to minimize the error between the data points and the function, using the method of least squares: Minimize the sum of the square of the errors Linear Regression fits a straight line to the data. That is, it fits the function: f (x) = ao + a, x Where ao and a are the linear fit coefficients to be determined using the method of least squares. In the case of Linear Regression, the method of least squares results in explicit formulas for the coefficients, given by: PL ssion1 example: Tt Reference the data in attached workbook, on sheet "Linear Regression", which includes a series of f (x) vs. x data points, i = 1,2,3, n, where x is the independent variable and n is the number of data points in the series Create a Main Sub procedure that will: Read the data series from the "Raw Data" table into a two-dimensional array that is appropriately sized to store the data Use loop structures to calculate the linear fit coefficients, and store their values in local procedure variables Write the linear fit coefficients to the output cells for ao and a Use a loop structure to read each "Total Time" value in the "Linear Fit" table, and write out the corresponding "Velocity" value. e Add a printable run button that will execute your Main Sub Then, create a proper graph to display the raw data (using plot symbols only) and the linear fit (using lines only). Linear Regression Regression analysis fits an assumed function to a given set of data points. The function won't pass through all of the data points, and it may not pass through any, but it will be the best fit of the assumed function. The best fit is found by optimizing the function coefficients in order to minimize the error between the data points and the function, using the method of least squares: Minimize the sum of the square of the errors Linear Regression fits a straight line to the data. That is, it fits the function: f (x) = ao + a, x Where ao and a are the linear fit coefficients to be determined using the method of least squares. In the case of Linear Regression, the method of least squares results in explicit formulas for the coefficients, given by: PL ssion1 example: Tt Reference the data in attached workbook, on sheet "Linear Regression", which includes a series of f (x) vs. x data points, i = 1,2,3, n, where x is the independent variable and n is the number of data points in the series Create a Main Sub procedure that will: Read the data series from the "Raw Data" table into a two-dimensional array that is appropriately sized to store the data Use loop structures to calculate the linear fit coefficients, and store their values in local procedure variables Write the linear fit coefficients to the output cells for ao and a Use a loop structure to read each "Total Time" value in the "Linear Fit" table, and write out the corresponding "Velocity" value. e Add a printable run button that will execute your Main Sub Then, create a proper graph to display the raw data (using plot symbols only) and the linear fit (using lines only)


