

Answered step by step
Verified Expert Solution
Question
1 Approved Answer
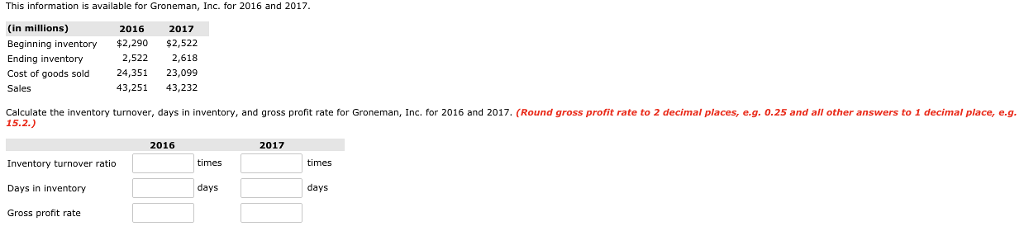
This information is available for Groneman, Inc. for 2016 and 2017 (in millions) Beginning inventory Ending inventory Cost of goods sold Sales 2017 $2,522 2,522
Step by Step Solution
There are 3 Steps involved in it
Step: 1

Get Instant Access to Expert-Tailored Solutions
See step-by-step solutions with expert insights and AI powered tools for academic success
Step: 2

Step: 3
Ace Your Homework with AI
Get the answers you need in no time with our AI-driven, step-by-step assistance
Get Started
Advanced Auditing And Assurance
Authors: Louise Kelly
1st Edition
978-1908199362