Answered step by step
Verified Expert Solution
Question
1 Approved Answer
This is a Collaborative Learning Community ( CLC ) assignment. The purpose of this assignment is to evaluate a company's profitability from the perspective of
This is a Collaborative Learning Community CLC assignment.
The purpose of this assignment is to evaluate a company's profitability from the perspective of an external stakeholder.
Profitability ratios are used by potential investors to assess a company's productivity and may provide insight into the company's historical net profit margin.
Part : External Stakeholder: Investor Ratios
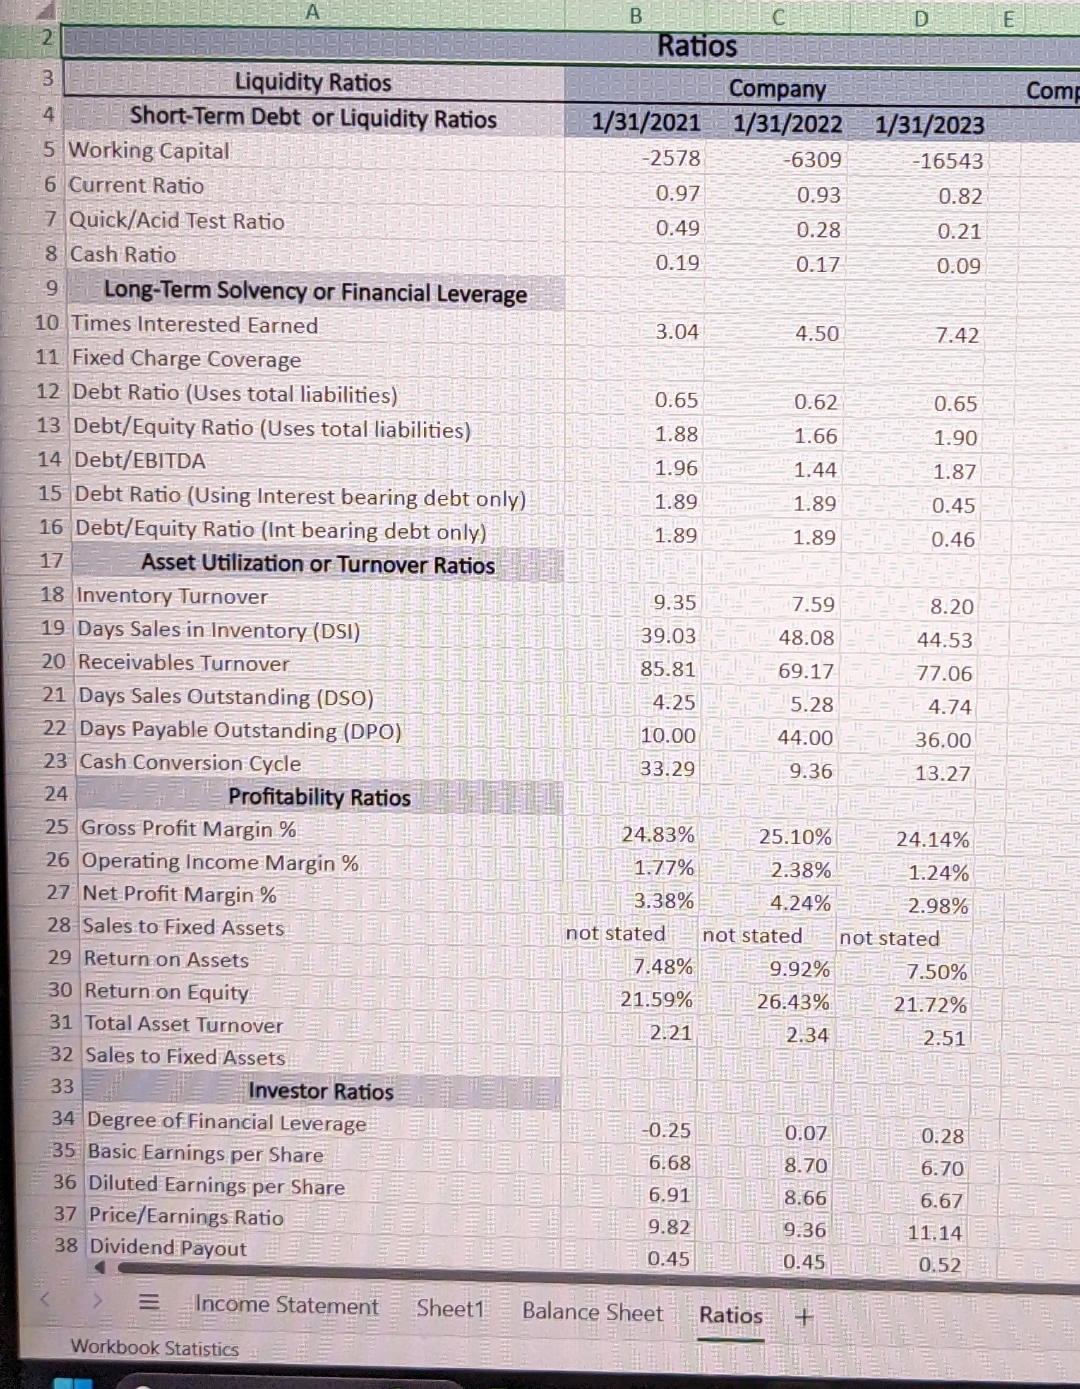
In the Ratios tab of the FSAR Excel Spreadsheet, complete the Investor Ratios section. Calculate the investor ratios.
Address the following analysis questions in the comments section of each ratio:
Identify what accounts changed for the period and explain how this affected the Financial Analysis calculation.
Explain the account change during the period and what business decisions may have caused the change.
Describe how changes impact the company's performance. just the summary value.
This is on Walmart
Working Capital Current RatioQuickAcid Test RatioCash RatioShortTerm Debt or Liquidity RatiosLiquidity Ratios Times Interested Earned Fixed Charge CoverageLongTerm Solvency or Financial Leverage Debt Ratio Uses total liabilities DebtEquity Ratio Uses total liabilities DebtEBITDA Debt Ratio Using Interest bearing debt only DebtEquity Ratio Int bearing debt only Inventory TurnoverAsset Utilization or Turnover Ratios Days Sales in lInventory DSI Receivables Turnover Days Sales Outstanding DSO Days Payable Outstanding DPO Cash Conversion CycleProfitability Ratios Gross Profit Margin Operating Income Margin Net Profit Margin Sales to Fixed Assets Return on Assets Return on Equity Total Asset Turnover Sales to Fixed AssetsInvestor Ratios Degree ofFinancial Leverage Basic Earnings per Share Diluted Earnings per Share PriceEarnings Ratio Dividend PayoutIncome StatementWorkbok StatisticsBRatiosnot statedSheet Balance SheetCompanyRatiosnot statedE Tnot statedComp
Step by Step Solution
There are 3 Steps involved in it
Step: 1

Get Instant Access to Expert-Tailored Solutions
See step-by-step solutions with expert insights and AI powered tools for academic success
Step: 2

Step: 3
Ace Your Homework with AI
Get the answers you need in no time with our AI-driven, step-by-step assistance
Get Started