THIS IS A COMPANY I AM WORKING ON FOR BUSINESS POLICIES AND NEED HELP GETTING STARTED ESPECIALLY WITH THE EXCEL SPREADSHEET PART!!! THANK YOU!!! TAKE YOUR TIME IF YOU MUST I WANT TO BE ABLE TO UNDERSTAND EVERY DETAIL!!! THE COMPANY IS AMERICAN AIRLINES!!! 481111 SCHEDULED PASSENGER AIR TRANSPORTATION FYE = DECEMBER
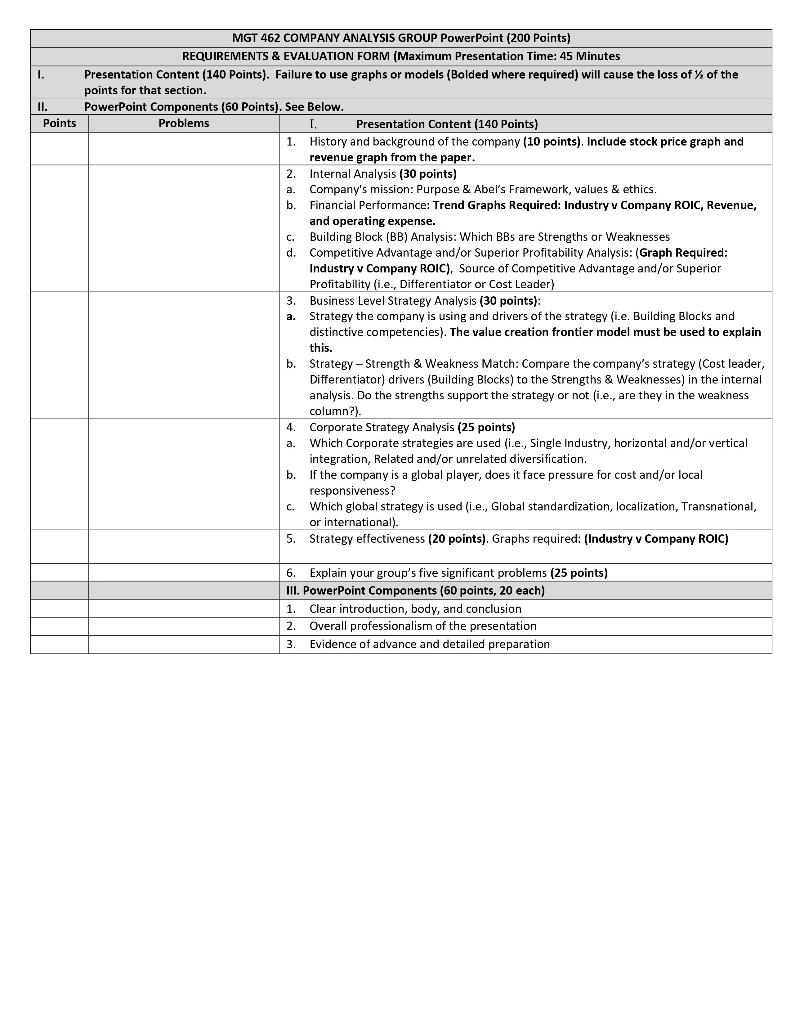
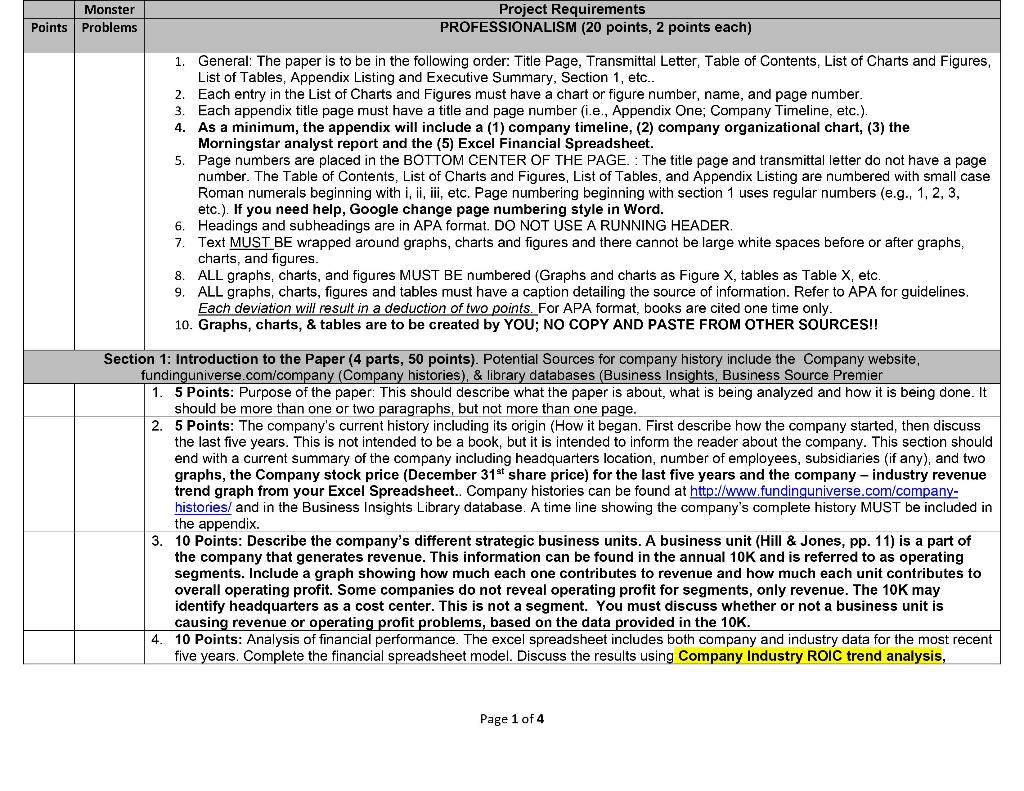
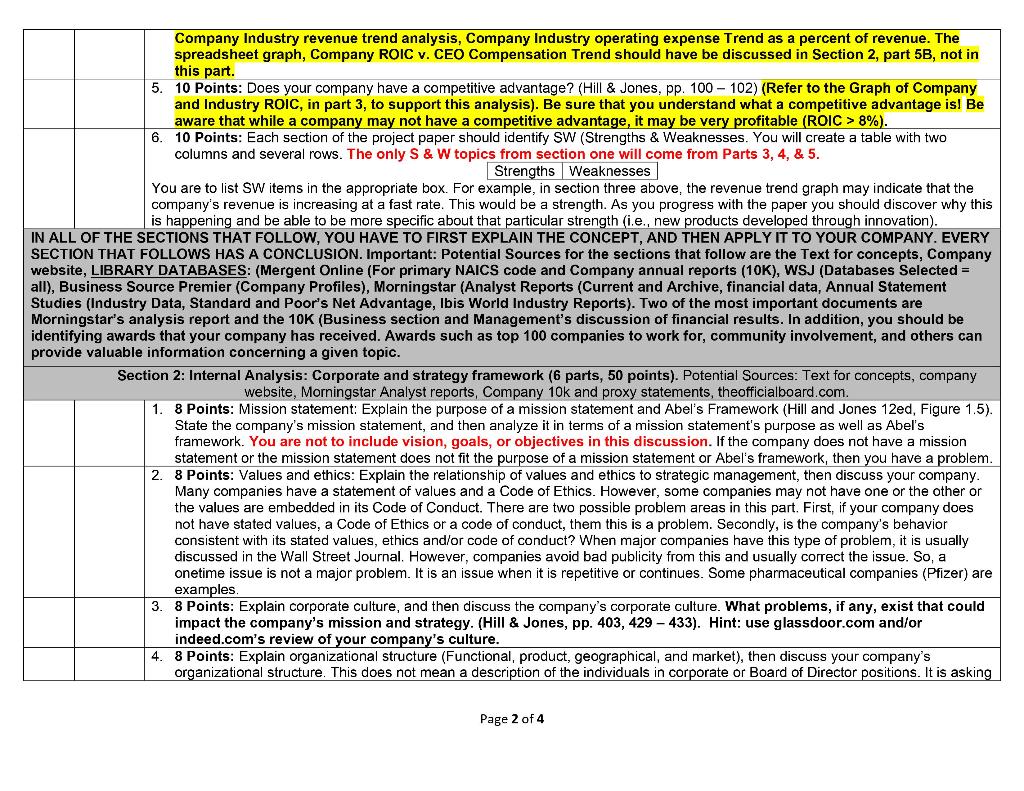
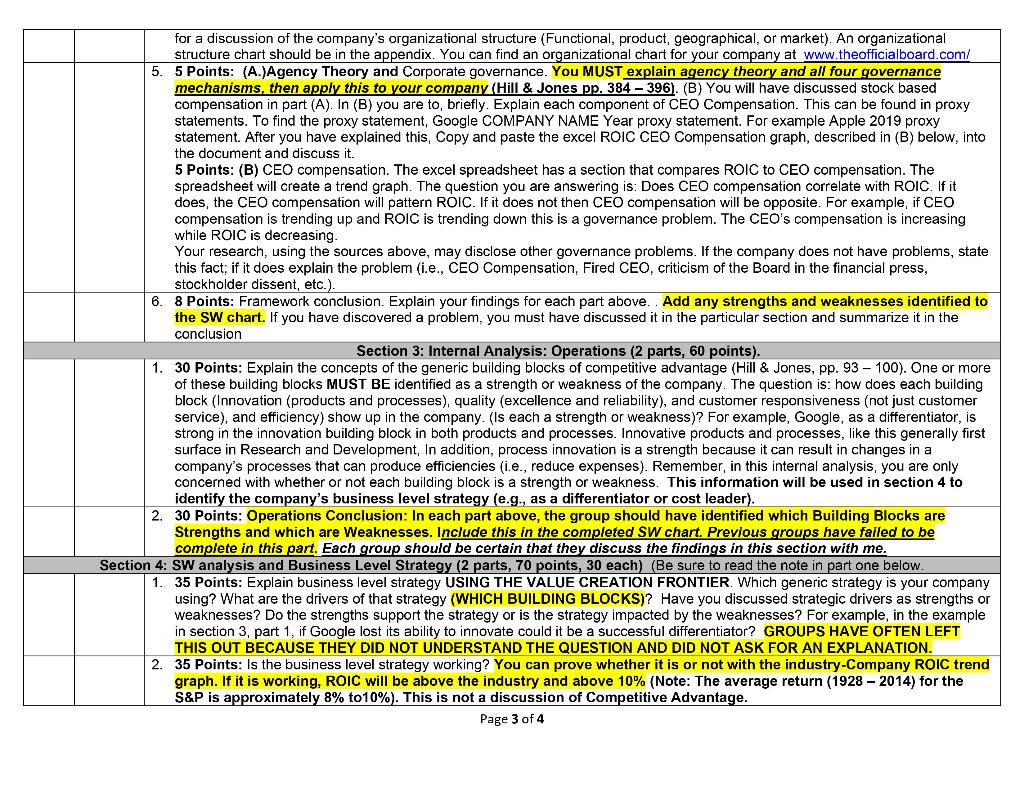
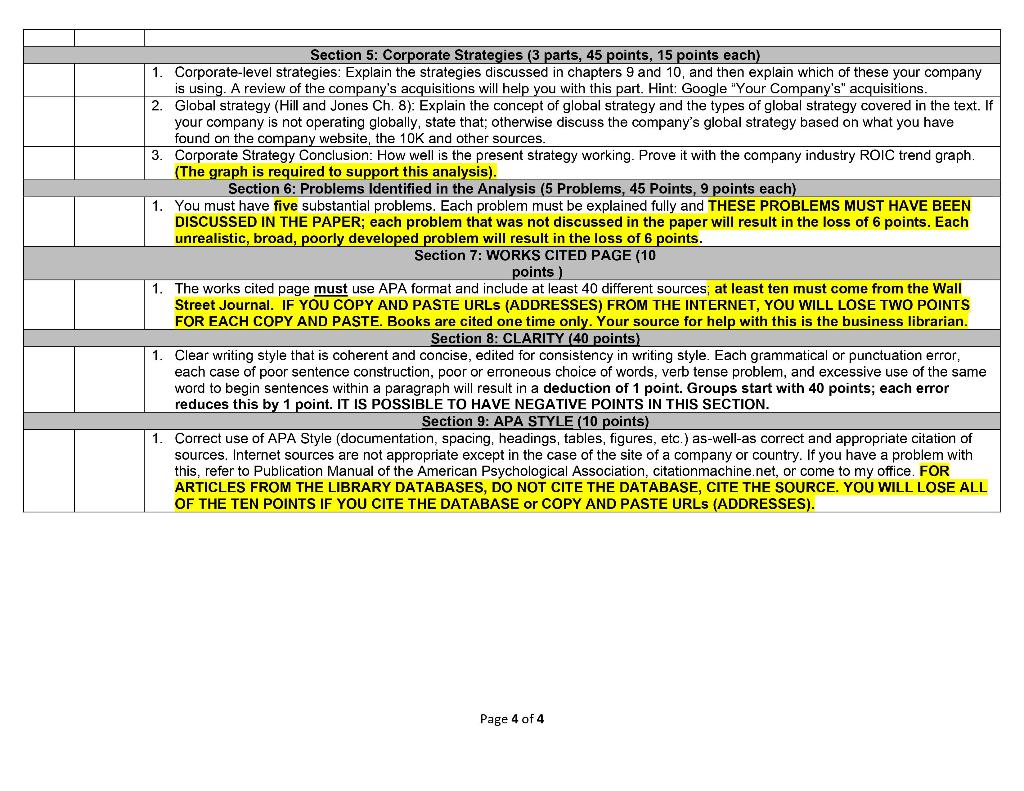
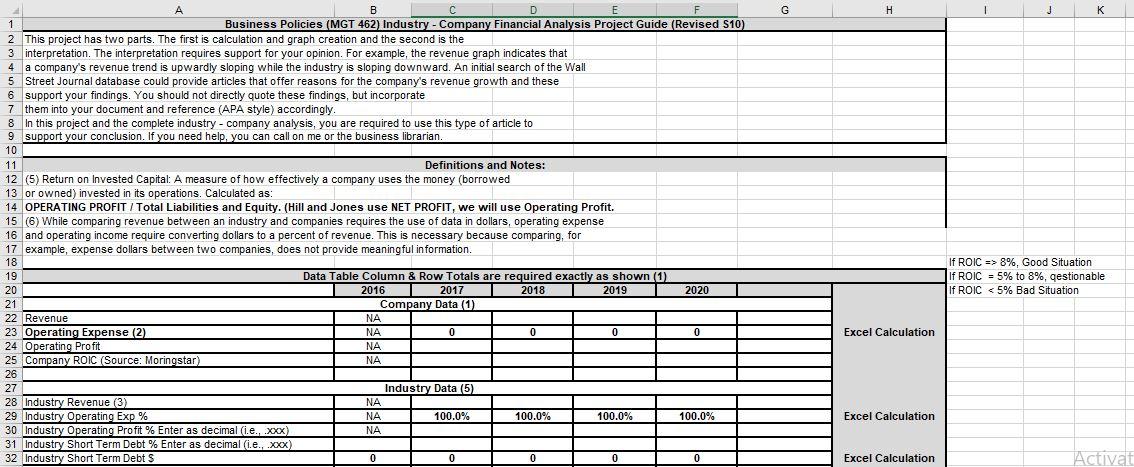
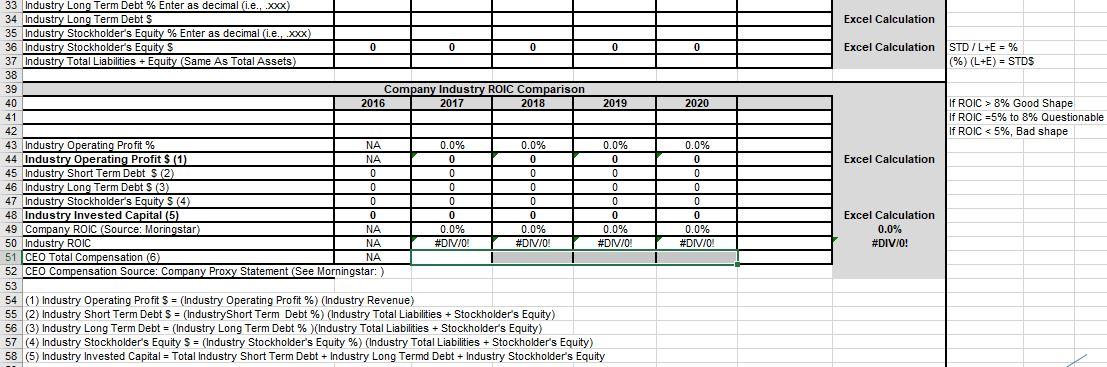
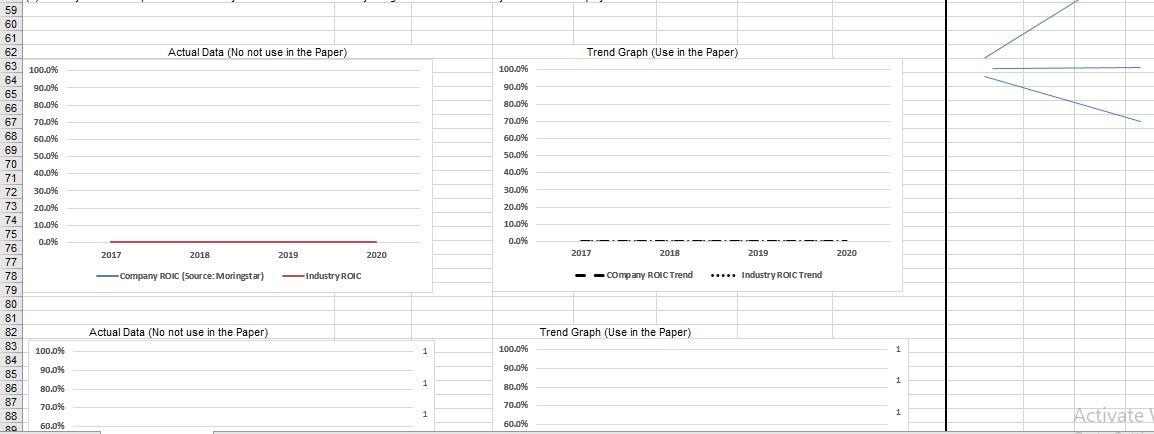
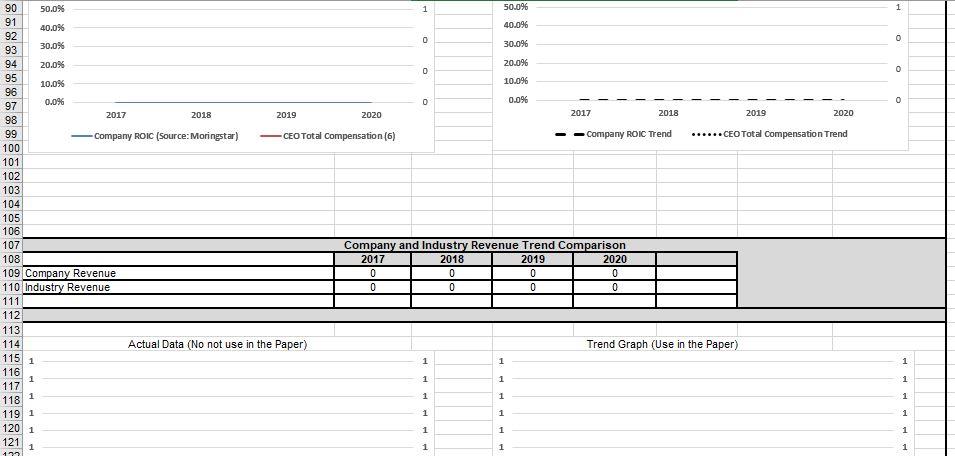
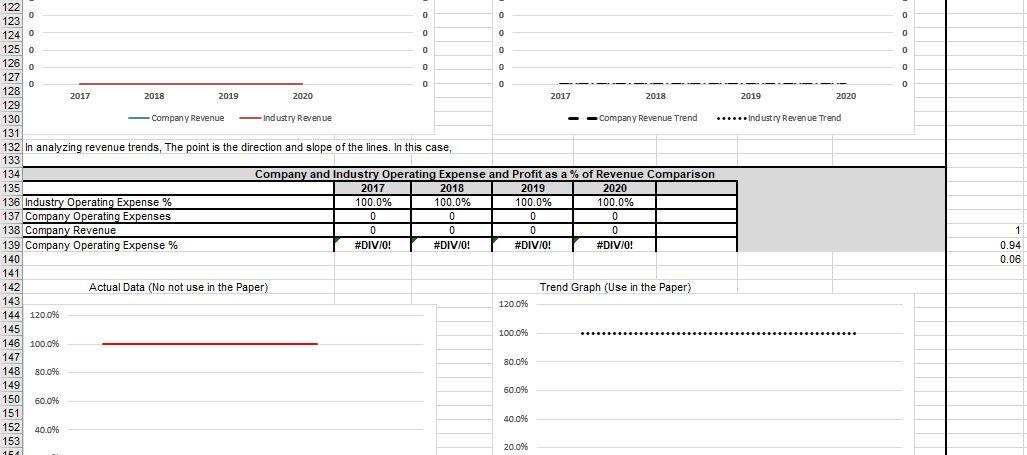
I. II. Points a. b. and operating expense. MGT 462 COMPANY ANALYSIS GROUP PowerPoint (200 Points) REQUIREMENTS & EVALUATION FORM (Maximum Presentation Time: 45 Minutes Presentation Content (140 Points). Failure to use graphs or models (Bolded where required) will cause the loss of y of the points for that section. PowerPoint Components (60 Points). See Below. Problems Presentation Content (140 Points) 1. History and background of the company (10 points). Include stock price graph and revenue graph from the paper. 2. Internal Analysis (30 points) Company's mission: Purpose & Abel's Framework, values & ethics. Financial Performance: Trend Graphs Required: Industry v Company ROIC, Revenue, and oper c. Building Block (BB) Analysis: Which BBs are Strengths or Weaknesses d. Competitive Advantage and/or Superior Profitability Analysis: (Graph Required: Industry v Company ROIC), Source of Competitive Advantage and/or Superior Profitability (i.e., Differentiator or Cost Leader) 3. Business Level Strategy Analysis (30 points): a. Strategy the company is using and drivers of the strategy (i.e. Building Blocks and distinctive competencies). The value creation frontier model must be used to explain this. b. Strategy - Strength & Weakness Match: Compare the company's strategy (Cost leader, Differentiator) drivers (Building Blocks) to the Strengths & Weaknesses) in the internal analysis. Do the strengths support the strategy or not (i.e., are they in the weakness column?). Corporate Strategy Analysis (25 points) Which Corporate strategies are used (i.e., Single Industry, horizontal and/or vertical integration, Related and/or unrelated diversification. the company is a global player, does it face pressure for cost and/or local responsiveness? Which global strategy is used (i.e., Global standardization, localization, Transnational, or international) 5. Strategy effectiveness (20 points). Graphs required: (Industry v Company ROIC) b. c. 6. Explain your group's five significant problems (25 points) III. PowerPoint Components (60 points, 20 each) 1. Clear introduction, body, and conclusion 2. Overall professionalism of the presentation 3 Evidence of advance and detailed preparation Monster Points Problems Project Requirements PROFESSIONALISM (20 points, 2 points each) 2. 1. General: The paper is to be in the following order: Title Page, Transmittal Letter, Table of Contents, List of Charts and Figures, List of Tables, Appendix Listing and Executive Summary, Section 1, etc.. Each entry in the List of Charts and Figures must have a chart or figure number, name, and page number. 3. Each appendix title page must have a title and page number (i.e., Appendix One; Company Timeline, etc.). 4. As a minimum, the appendix will include a (1) company timeline, (2) company organizational chart, (3) the Morningstar analyst report and the (5) Excel Financial Spreadsheet. 5. Page numbers are placed in the BOTTOM CENTER OF THE PAGE. : The title page and transmittal letter do not have a page number. The Table of Contents, List of Charts and Figures, List of Tables, and Appendix Listing are numbered with small case Roman numerals beginning with i, ii, iii, etc. Page numbering beginning with section uses regular numbers (e.g., 1, 2, 3, If you need help, Google change page numbering style in Word. 6. Headings and subheadings are in APA format. DO NOT USE A RUNNING HEADER 7. Text MUST BE wrapped around graphs, charts and figures and there cannot be large white spaces before or after graphs, charts, and figures. 8. ALL graphs, charts, and figures MUST BE numbered (Graphs and charts as Figure X, tables as Table X, etc. 9. ALL graphs, charts, figures and tables must have a caption detailing the source of information. Refer to APA for guidelines. Each deviation will result in a deduction of two points. For APA format, books are cited one time only. 10. Graphs, charts, & tables are to be created by YOU; NO COPY AND PASTE FROM OTHER SOURCES!! etc.) Section 1: Introduction to the Paper (4 parts, 50 points). Potential Sources for company history include the Company website, fundinguniverse.com/company (Company histories), & library databases (Business Insights, Business Source Premier 1. 5 Points: Purpose of the paper: This should describe what the paper is about what is being analyzed and how it is being done. It should be more than one or two paragraphs, but not more than one page. 2. 5 Points: The company's current history including its origin (How it began. First describe how the company started, then discuss the last five years. This is not intended to be a book, but it is intended to inform the reader about the company. This section should end with a current summary of the company including headquarters location, number of employees, subsidiaries (if any), and two graphs, the Company stock price (December 31st share price) for the last five years and the company - industry revenue trend graph from your Excel Spreadsheet.. Company histories can be found at http://www.fundinguniverse.com/company- histories/ and in the Business Insights Library database. A time line showing the company's complete history MUST be included in the appendix. 3. 10 Points: Describe the company's different strategic business units. A business unit (Hill & Jones, pp. 11) is a part of the company that generates revenue. This information can be found in the annual 10K and is referred to as operating segments. Include a graph showing how much each one contributes to revenue and how much each unit contributes to overall operating profit. Some companies do not reveal operating profit for segments, only revenue. The 10K may identify headquarters as a cost center. This is not a segment. You must discuss whether or not business unit is causing revenue or operating profit problems, based on the data provided in the 10K. 10 Points: Analysis of financial performance. The excel spreadsheet includes both company and industry data for the most recent five years. Complete the financial spreadsheet model. Discuss the results using Company Industry ROIC trend analysis, 4. Page 1 of 4 Company Industry revenue trend analysis, Company Industry operating expense Trend as a percent of revenue. The spreadsheet graph, Company ROIC v. CEO Compensation Trend should have be discussed in Section 2, part 5B, not in this part. 5. 10 Points: Does your company have a competitive advantage? (Hill & Jones, pp. 100 - 102) (Refer to the Graph of Company and Industry ROIC, in part 3, to support this analysis). Be sure that you understand what a competitive advantage is! Be aware that while a company may not have a competitive advantage, it may be very profitable (ROIC > 8%). 6. 10 Points: Each section of the project paper should identify SW (Strengths & Weaknesses. You will create table with two columns and several rows. The only S & W topics from section one will come from Parts 3, 4, & 5. Strengths Weaknesses You are to list SW items in the appropriate box. For example, in section three above, the revenue trend graph may indicate that the company's revenue is increasing at a fast rate. This would be a strength. As you progress with the paper you should discover why this is happening and be able to be more specific about that particular strength (i.e., new products developed through innovation). IN ALL OF THE SECTIONS THAT FOLLOW, YOU HAVE TO FIRST EXPLAIN THE CONCEPT, AND THEN APPLY IT TO YOUR COMPANY. EVERY SECTION THAT FOLLOWS HAS A CONCLUSION. Important: Potential Sources for the sections that follow are the Text for concepts, Company website, LIBRARY DATABASES: (Mergent Online (For primary NAICS code and Company annual reports (10K), WSJ (Databases Selected = all), Business Source Premier (Company Profiles), Morningstar (Analyst Reports (Current and Archive, financial data, Annual Statement Studies (Industry Data, Standard and Poor's Net Advantage, Ibis World Industry Reports). Two of the most important documents are Morningstar's analysis report and the 10K (Business section and Management's discussion of financial results. In addition, you should be identifying awards that your company has received. Awards such as top 100 companies to work for, community involvement, and others can provide valuable information concerning a given topic. Section 2: Internal Analysis: Corporate and strategy framework (6 parts, 50 points). Potential Sources: Text for concepts, company website, Morningstar Analyst reports, Company 10k and proxy statements, theofficialboard.com 1. 8 Points: Mission statement: Explain the purpose of a mission statement and Abel's Framework (Hill and Jones 12ed, Figure 1.5). State the company's mission statement, and then analyze it in terms of a mission statement's purpose as well as Abel's framework. You are not to include vision, goals, or objectives in this discussion. If the company does not have a mission statement or the mission statement does not fit the purpose of a mission statement or Abel's framework, then you have a problem. 2.8 Points: Values and ethics: Explain the relationship of values and ethics to strategic management, then discuss your company. Many companies have a statement of values and a Code of Ethics. However, some companies may not have one or the other or the values are embedded in its Code of Conduct. There are two possible problem areas in this part. First, if your company does not have stated values, a Code of Ethics or a code of conduct, them this is a problem. Secondly, is the company's behavior consistent with its stated values, ethics and/or code of conduct? When major companies have this type of problem, it is usually discussed in the Wall Street Journal. However, companies avoid bad publicity from this and usually correct the issue. So, a onetime issue is not a major problem. It is an issue when it is repetitive or continues. Some pharmaceutical companies (Pfizer) are examples 3 8 Points: Explain corporate culture, and then discuss the company's corporate culture. What problems, if any, exist that could impact the company's mission and strategy. (Hill & Jones, pp. 403, 429-433). Hint: use glassdoor.com and/or indeed.com's review of your company's culture. 8 Points: Explain organizational structure (Functional, product, geographical, and market), then discuss your company's organizational structure. This does not mean a description of the individuals in corporate or Board of Director positions. It is asking 4 Page 2 of 4 for a discussion of the company's organizational structure (Functional, product, geographical, or market). An organizational structure chart should be in the appendix. You can find an organizational chart for your company at www.theofficialboard.com/ 5. 5 Points: (A.)Agency Theory and Corporate governance. You MUST explain agency theory and all four governance mechanisms, then apply this to your company (Hill & Jones pp. 384 396). (B) You will have discussed stock based compensation in part (A). In (B) you are to, briefly. Explain each component of CEO Compensation. This can be found in proxy statements. To find the proxy statement, Google COMPANY NAME Year proxy statement. For example Apple 2019 proxy statement. After you have explained this, Copy and paste the excel ROIC CEO Compensation graph, described in (B) below, into the document and discuss it. 5 Points: (B) CEO compensation. The excel spreadsheet has a section that compares ROIC to CEO compensation. The spreadsheet will create trend graph. The question you are answering is: Does CEO compensation correlate with ROIC. If it does, the CEO compensation will pattern ROIC. If it does not then CEO compensation will be opposite. For example, if CEO compensation is trending up and ROIC is trending down this is a governance problem. The CEO's compensation is increasing while ROIC is decreasing. Your research, using the sources above, may disclose other governance problems. If the company does not have problems, state this fact; if it does explain the problem (i.e., CEO Compensation, Fired CEO, criticism of the Board in the financial press, stockholder dissent, etc.). 6. 8 Points: Framework conclusion. Explain your findings for each part above.. Add any strengths and weaknesses identified to the SW chart. If you have discovered a problem, you must have discussed it in the particular section and summarize it in the conclusion Section 3: Internal Analysis: Operations (2 parts, 60 points). 1. 30 Points: Explain the concepts of the generic building blocks of competitive advantage (Hill & Jones, pp. 93 - 100). One more of these building blocks MUST BE identified as a strength or weakness of the company. The question is: how does each building block (Innovation (products and processes), quality (excellence and reliability), and customer responsiveness (not just customer service), and efficiency) show up in the company. (Is each a strength or weakness)? For example, Google, as a differentiator, is strong in the innovation building block in both products and processes. Innovative products and processes, like this generally first surface in Research and Development, In addition, process innovation is a strength because it can result in changes in a company's processes that can produce efficiencies (i.e., reduce expenses). Remember, in this internal analysis, you are only concerned with whether or not each building block is a strength or weakness. This information will be used in section 4 to identify the company's business level strategy (e.g., as a differentiator or cost leader). 2. 30 Points: Operations Conclusion: In each part above, the group should have identified which Building Blocks are Strengths and which are Weaknesses. Include this in the completed SW chart. Previous groups have failed to be complete in this part. Each group should be certain that they discuss the findings in this section with me. Section 4: SW analysis and Business Level Strategy (2 parts, 70 points, 30 each) (Be sure to read the note in part one below. 1. 35 Points: Explain business level strategy USING THE VALUE CREATION FRONTIER. Which generic strategy is your company using? What are the drivers of that strategy (WHICH BUILDING BLOCKS)? Have you discussed strategic drivers as strengths or weaknesses? Do the strengths support the strategy or is the strategy impacted by the weaknesses? For example, in the example in section 3, part 1, if Google lost its ability to innovate could it be a successful differentiator? GROUPS HAVE OFTEN LEFT THIS OUT BECAUSE THEY DID NOT UNDERSTAND THE QUESTION AND DID NOT ASK FOR AN EXPLANATION. 2. 35 Points: Is the business level strategy working? You can prove whether it is or not with the industry-Company ROIC trend graph. If it is working, ROIC will be above the industry and above 10% (Note: The average return (1928-2014) for the S&P is approximately 8% to 10%). This is not a discussion of Competitive Advantage. Page 3 of 4 Section 5: Corporate Strategies (3 parts, 45 points, 15 points each) 1. Corporate-level strategies: Explain the strategies discussed in chapters 9 and 10, and then explain which of these your company is using. A review of the company's acquisitions will help you with this part. Hint: Google "Your Company's" acquisitions. 2. Global strategy (Hill and Jones Ch. 8): Explain the concept of global strategy and the types of global strategy covered in the text. If your company is not operating globally, state that otherwise discuss the company's global strategy based on what you have found on the company website, the 10K and other sources. 3. Corporate Strategy Conclusion: How well is the present strategy working. Prove it with the company industry ROIC trend graph. (The graph is required to support this analysis). Section 6: Problems Identified in the Analysis (5 Problems, 45 Points, 9 points each) 1. You must have five substantial problems. Each problem must be explained fully and THESE PROBLEMS MUST HAVE BEEN DISCUSSED IN THE PAPER; each problem that was not discussed in the paper will result in the loss of 6 points. Each unrealistic, broad, poorly developed problem will result in the loss of 6 points. Section 7: WORKS CITED PAGE (10 points) 1. The works cited page must use APA format and include at least 40 different sources; at least ten must come from the Wall Street Journal. IF YOU COPY AND PASTE URLS (ADDRESSES) FROM THE INTERNET, YOU WILL LOSE TWO POINTS FOR EACH COPY AND PASTE. Books are cited one time only. Your source for help with this is the business librarian. Section 8: CLARITY (40 points) 1. Clear writing style that is coherent and concise, edited for consistency in writing style. Each grammatical or punctuation error, each case of poor sentence construction, poor or erroneous choice of words, verb tense problem, and excessive use of the same word to begin sentences within a paragraph will result in a deduction of 1 point. Groups start with 40 points; each error reduces this by 1 point. IT IS POSSIBLE TO HAVE NEGATIVE POINTS IN THIS SECTION. Section 9: APA STYLE (10 points) 1. Correct use of APA Style (documentation, spacing, headings, tables, figures, etc.) as-well-as correct and appropriate citation of sources. Internet sources are not appropriate except in the case of the site of a company or country. If you have a problem with this, refer to Publication Manual of the American Psychological Association, citationmachine.net, or come to my office. FOR ARTICLES FROM THE LIBRARY DATABASES, DO NOT CITE THE DATABASE, CITE THE SOURCE. YOU WILL LOSE ALL OF THE TEN POINTS IF YOU CITE THE DATABASE or COPY AND PASTE URLs (ADDRESSES). Page 4 of 4 G H 1 J A B C D 1 Business Policies (MGT 462) Industry - Company Financial Analysis Project Guide (Revised S10 2 This project has two parts. The first is calculation and graph creation and the second is the 3 interpretation. The interpretation requires support for your opinion. For example, the revenue graph indicates that 4 a company's revenue trend is upwardly sloping while the industry is sloping downward. An initial search of the Wall 5 Street Journal database could provide articles that offer reasons for the company's revenue growth and these 6 support your findings. You should not directly quote these findings, but incorporate 7 them into your document and reference (APA style) accordingly, 8 In this project and the complete industry - company analysis, you are required to use this type of article to 9 support your conclusion. If you need help you can call on me or the business librarian. 10 11 Definitions and Notes: 12 (5) Return on invested Capital: A measure of how effectively a company uses the money (borrowed 13 or owned) invested in its operations. Calculated as: 14 OPERATING PROFIT / Total Liabilities and Equity. (Hill and Jones use NET PROFIT, we will use Operating Profit. 15 (6) While comparing revenue between an industry and companies requires the use of data in dollars, operating expense 16 and operating income require converting dollars to a percent of revenue. This is necessary because comparing, for 17 example, expense dollars between two companies, does not provide meaningful information 18 19 Data Table Column & Row Totals are required exactly as shown (1 20 2016 | 2017 2018 2019 2020 21 Company Data (1) 22 Revenue NA 23 Operating Expense (2) NA 0 0 0 24 Operating Profit NA 25 Company ROIC (Source: Moringstar) NA 26 27 Industry Data (5) 28 Industry Revenue (3) NA 29 Industry Operating Exp % NA 100.0% 100.0% 100.0% 100.0% 30 Industry Operating Profit % Enter as decimal (i.e., .xx) NA 31 Industry Short Term Debt % Enter as decimal (i.e., xxx) 32 Industry Short Term Debt S 0 0 0 0 0 If ROIC => 8%, Good Situation If ROIC - 5% to 8%, gestionable If ROIC 8% Good Shape If ROIC -5% to 8% Questionable If ROIC 8%). 6. 10 Points: Each section of the project paper should identify SW (Strengths & Weaknesses. You will create table with two columns and several rows. The only S & W topics from section one will come from Parts 3, 4, & 5. Strengths Weaknesses You are to list SW items in the appropriate box. For example, in section three above, the revenue trend graph may indicate that the company's revenue is increasing at a fast rate. This would be a strength. As you progress with the paper you should discover why this is happening and be able to be more specific about that particular strength (i.e., new products developed through innovation). IN ALL OF THE SECTIONS THAT FOLLOW, YOU HAVE TO FIRST EXPLAIN THE CONCEPT, AND THEN APPLY IT TO YOUR COMPANY. EVERY SECTION THAT FOLLOWS HAS A CONCLUSION. Important: Potential Sources for the sections that follow are the Text for concepts, Company website, LIBRARY DATABASES: (Mergent Online (For primary NAICS code and Company annual reports (10K), WSJ (Databases Selected = all), Business Source Premier (Company Profiles), Morningstar (Analyst Reports (Current and Archive, financial data, Annual Statement Studies (Industry Data, Standard and Poor's Net Advantage, Ibis World Industry Reports). Two of the most important documents are Morningstar's analysis report and the 10K (Business section and Management's discussion of financial results. In addition, you should be identifying awards that your company has received. Awards such as top 100 companies to work for, community involvement, and others can provide valuable information concerning a given topic. Section 2: Internal Analysis: Corporate and strategy framework (6 parts, 50 points). Potential Sources: Text for concepts, company website, Morningstar Analyst reports, Company 10k and proxy statements, theofficialboard.com 1. 8 Points: Mission statement: Explain the purpose of a mission statement and Abel's Framework (Hill and Jones 12ed, Figure 1.5). State the company's mission statement, and then analyze it in terms of a mission statement's purpose as well as Abel's framework. You are not to include vision, goals, or objectives in this discussion. If the company does not have a mission statement or the mission statement does not fit the purpose of a mission statement or Abel's framework, then you have a problem. 2.8 Points: Values and ethics: Explain the relationship of values and ethics to strategic management, then discuss your company. Many companies have a statement of values and a Code of Ethics. However, some companies may not have one or the other or the values are embedded in its Code of Conduct. There are two possible problem areas in this part. First, if your company does not have stated values, a Code of Ethics or a code of conduct, them this is a problem. Secondly, is the company's behavior consistent with its stated values, ethics and/or code of conduct? When major companies have this type of problem, it is usually discussed in the Wall Street Journal. However, companies avoid bad publicity from this and usually correct the issue. So, a onetime issue is not a major problem. It is an issue when it is repetitive or continues. Some pharmaceutical companies (Pfizer) are examples 3 8 Points: Explain corporate culture, and then discuss the company's corporate culture. What problems, if any, exist that could impact the company's mission and strategy. (Hill & Jones, pp. 403, 429-433). Hint: use glassdoor.com and/or indeed.com's review of your company's culture. 8 Points: Explain organizational structure (Functional, product, geographical, and market), then discuss your company's organizational structure. This does not mean a description of the individuals in corporate or Board of Director positions. It is asking 4 Page 2 of 4 for a discussion of the company's organizational structure (Functional, product, geographical, or market). An organizational structure chart should be in the appendix. You can find an organizational chart for your company at www.theofficialboard.com/ 5. 5 Points: (A.)Agency Theory and Corporate governance. You MUST explain agency theory and all four governance mechanisms, then apply this to your company (Hill & Jones pp. 384 396). (B) You will have discussed stock based compensation in part (A). In (B) you are to, briefly. Explain each component of CEO Compensation. This can be found in proxy statements. To find the proxy statement, Google COMPANY NAME Year proxy statement. For example Apple 2019 proxy statement. After you have explained this, Copy and paste the excel ROIC CEO Compensation graph, described in (B) below, into the document and discuss it. 5 Points: (B) CEO compensation. The excel spreadsheet has a section that compares ROIC to CEO compensation. The spreadsheet will create trend graph. The question you are answering is: Does CEO compensation correlate with ROIC. If it does, the CEO compensation will pattern ROIC. If it does not then CEO compensation will be opposite. For example, if CEO compensation is trending up and ROIC is trending down this is a governance problem. The CEO's compensation is increasing while ROIC is decreasing. Your research, using the sources above, may disclose other governance problems. If the company does not have problems, state this fact; if it does explain the problem (i.e., CEO Compensation, Fired CEO, criticism of the Board in the financial press, stockholder dissent, etc.). 6. 8 Points: Framework conclusion. Explain your findings for each part above.. Add any strengths and weaknesses identified to the SW chart. If you have discovered a problem, you must have discussed it in the particular section and summarize it in the conclusion Section 3: Internal Analysis: Operations (2 parts, 60 points). 1. 30 Points: Explain the concepts of the generic building blocks of competitive advantage (Hill & Jones, pp. 93 - 100). One more of these building blocks MUST BE identified as a strength or weakness of the company. The question is: how does each building block (Innovation (products and processes), quality (excellence and reliability), and customer responsiveness (not just customer service), and efficiency) show up in the company. (Is each a strength or weakness)? For example, Google, as a differentiator, is strong in the innovation building block in both products and processes. Innovative products and processes, like this generally first surface in Research and Development, In addition, process innovation is a strength because it can result in changes in a company's processes that can produce efficiencies (i.e., reduce expenses). Remember, in this internal analysis, you are only concerned with whether or not each building block is a strength or weakness. This information will be used in section 4 to identify the company's business level strategy (e.g., as a differentiator or cost leader). 2. 30 Points: Operations Conclusion: In each part above, the group should have identified which Building Blocks are Strengths and which are Weaknesses. Include this in the completed SW chart. Previous groups have failed to be complete in this part. Each group should be certain that they discuss the findings in this section with me. Section 4: SW analysis and Business Level Strategy (2 parts, 70 points, 30 each) (Be sure to read the note in part one below. 1. 35 Points: Explain business level strategy USING THE VALUE CREATION FRONTIER. Which generic strategy is your company using? What are the drivers of that strategy (WHICH BUILDING BLOCKS)? Have you discussed strategic drivers as strengths or weaknesses? Do the strengths support the strategy or is the strategy impacted by the weaknesses? For example, in the example in section 3, part 1, if Google lost its ability to innovate could it be a successful differentiator? GROUPS HAVE OFTEN LEFT THIS OUT BECAUSE THEY DID NOT UNDERSTAND THE QUESTION AND DID NOT ASK FOR AN EXPLANATION. 2. 35 Points: Is the business level strategy working? You can prove whether it is or not with the industry-Company ROIC trend graph. If it is working, ROIC will be above the industry and above 10% (Note: The average return (1928-2014) for the S&P is approximately 8% to 10%). This is not a discussion of Competitive Advantage. Page 3 of 4 Section 5: Corporate Strategies (3 parts, 45 points, 15 points each) 1. Corporate-level strategies: Explain the strategies discussed in chapters 9 and 10, and then explain which of these your company is using. A review of the company's acquisitions will help you with this part. Hint: Google "Your Company's" acquisitions. 2. Global strategy (Hill and Jones Ch. 8): Explain the concept of global strategy and the types of global strategy covered in the text. If your company is not operating globally, state that otherwise discuss the company's global strategy based on what you have found on the company website, the 10K and other sources. 3. Corporate Strategy Conclusion: How well is the present strategy working. Prove it with the company industry ROIC trend graph. (The graph is required to support this analysis). Section 6: Problems Identified in the Analysis (5 Problems, 45 Points, 9 points each) 1. You must have five substantial problems. Each problem must be explained fully and THESE PROBLEMS MUST HAVE BEEN DISCUSSED IN THE PAPER; each problem that was not discussed in the paper will result in the loss of 6 points. Each unrealistic, broad, poorly developed problem will result in the loss of 6 points. Section 7: WORKS CITED PAGE (10 points) 1. The works cited page must use APA format and include at least 40 different sources; at least ten must come from the Wall Street Journal. IF YOU COPY AND PASTE URLS (ADDRESSES) FROM THE INTERNET, YOU WILL LOSE TWO POINTS FOR EACH COPY AND PASTE. Books are cited one time only. Your source for help with this is the business librarian. Section 8: CLARITY (40 points) 1. Clear writing style that is coherent and concise, edited for consistency in writing style. Each grammatical or punctuation error, each case of poor sentence construction, poor or erroneous choice of words, verb tense problem, and excessive use of the same word to begin sentences within a paragraph will result in a deduction of 1 point. Groups start with 40 points; each error reduces this by 1 point. IT IS POSSIBLE TO HAVE NEGATIVE POINTS IN THIS SECTION. Section 9: APA STYLE (10 points) 1. Correct use of APA Style (documentation, spacing, headings, tables, figures, etc.) as-well-as correct and appropriate citation of sources. Internet sources are not appropriate except in the case of the site of a company or country. If you have a problem with this, refer to Publication Manual of the American Psychological Association, citationmachine.net, or come to my office. FOR ARTICLES FROM THE LIBRARY DATABASES, DO NOT CITE THE DATABASE, CITE THE SOURCE. YOU WILL LOSE ALL OF THE TEN POINTS IF YOU CITE THE DATABASE or COPY AND PASTE URLs (ADDRESSES). Page 4 of 4 G H 1 J A B C D 1 Business Policies (MGT 462) Industry - Company Financial Analysis Project Guide (Revised S10 2 This project has two parts. The first is calculation and graph creation and the second is the 3 interpretation. The interpretation requires support for your opinion. For example, the revenue graph indicates that 4 a company's revenue trend is upwardly sloping while the industry is sloping downward. An initial search of the Wall 5 Street Journal database could provide articles that offer reasons for the company's revenue growth and these 6 support your findings. You should not directly quote these findings, but incorporate 7 them into your document and reference (APA style) accordingly, 8 In this project and the complete industry - company analysis, you are required to use this type of article to 9 support your conclusion. If you need help you can call on me or the business librarian. 10 11 Definitions and Notes: 12 (5) Return on invested Capital: A measure of how effectively a company uses the money (borrowed 13 or owned) invested in its operations. Calculated as: 14 OPERATING PROFIT / Total Liabilities and Equity. (Hill and Jones use NET PROFIT, we will use Operating Profit. 15 (6) While comparing revenue between an industry and companies requires the use of data in dollars, operating expense 16 and operating income require converting dollars to a percent of revenue. This is necessary because comparing, for 17 example, expense dollars between two companies, does not provide meaningful information 18 19 Data Table Column & Row Totals are required exactly as shown (1 20 2016 | 2017 2018 2019 2020 21 Company Data (1) 22 Revenue NA 23 Operating Expense (2) NA 0 0 0 24 Operating Profit NA 25 Company ROIC (Source: Moringstar) NA 26 27 Industry Data (5) 28 Industry Revenue (3) NA 29 Industry Operating Exp % NA 100.0% 100.0% 100.0% 100.0% 30 Industry Operating Profit % Enter as decimal (i.e., .xx) NA 31 Industry Short Term Debt % Enter as decimal (i.e., xxx) 32 Industry Short Term Debt S 0 0 0 0 0 If ROIC => 8%, Good Situation If ROIC - 5% to 8%, gestionable If ROIC 8% Good Shape If ROIC -5% to 8% Questionable If ROIC