

Answered step by step
Verified Expert Solution
Question
1 Approved Answer
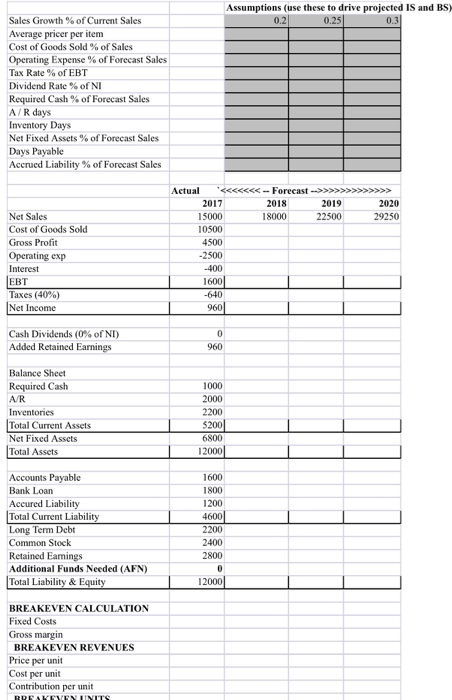
This is a forecast. The instructions are attached. Please fill in the spreadsheet attached. for reference on cells. Sales growth % of current sales is
This is a forecast. The instructions are attached. Please fill in the spreadsheet attached. for reference on cells. Sales growth % of current sales is A2. PLS DO NOT HARDCODE. I NEED FORMULAS PLEASE. 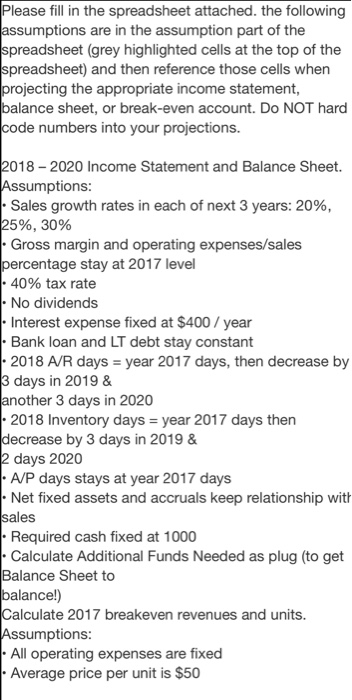
Step by Step Solution
There are 3 Steps involved in it
Step: 1

Get Instant Access to Expert-Tailored Solutions
See step-by-step solutions with expert insights and AI powered tools for academic success
Step: 2

Step: 3
Ace Your Homework with AI
Get the answers you need in no time with our AI-driven, step-by-step assistance
Get Started
Analysing The Value Proposition Of The Audit Process In Africa The Case Of Malawi
Authors: Daniel Dunga
1st Edition
3659166286, 978-3659166280