***This is a long question with multiple parts but I only need help on the last part (The chart that I left blank). I just added all of the parts so you had all of the information***
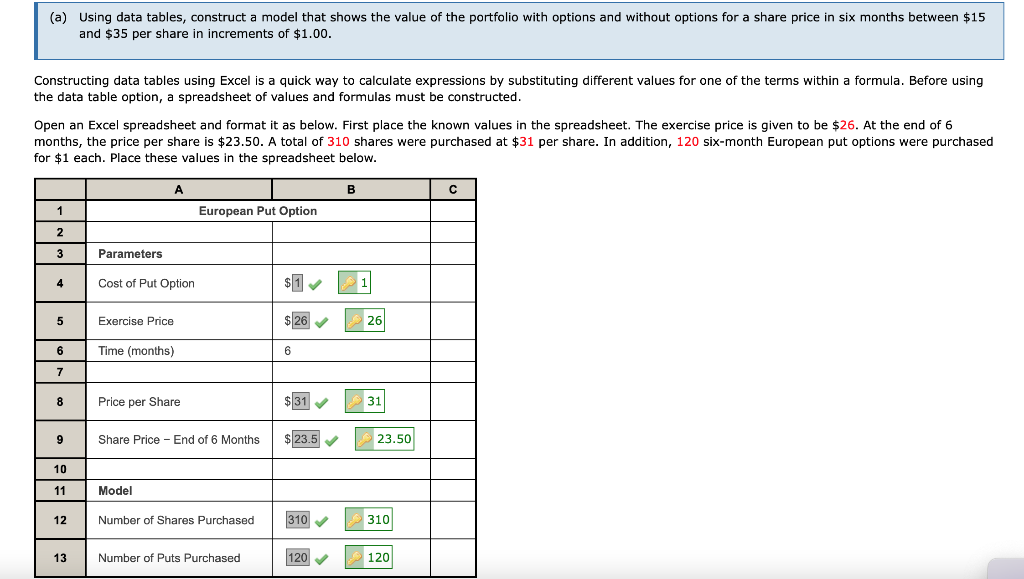
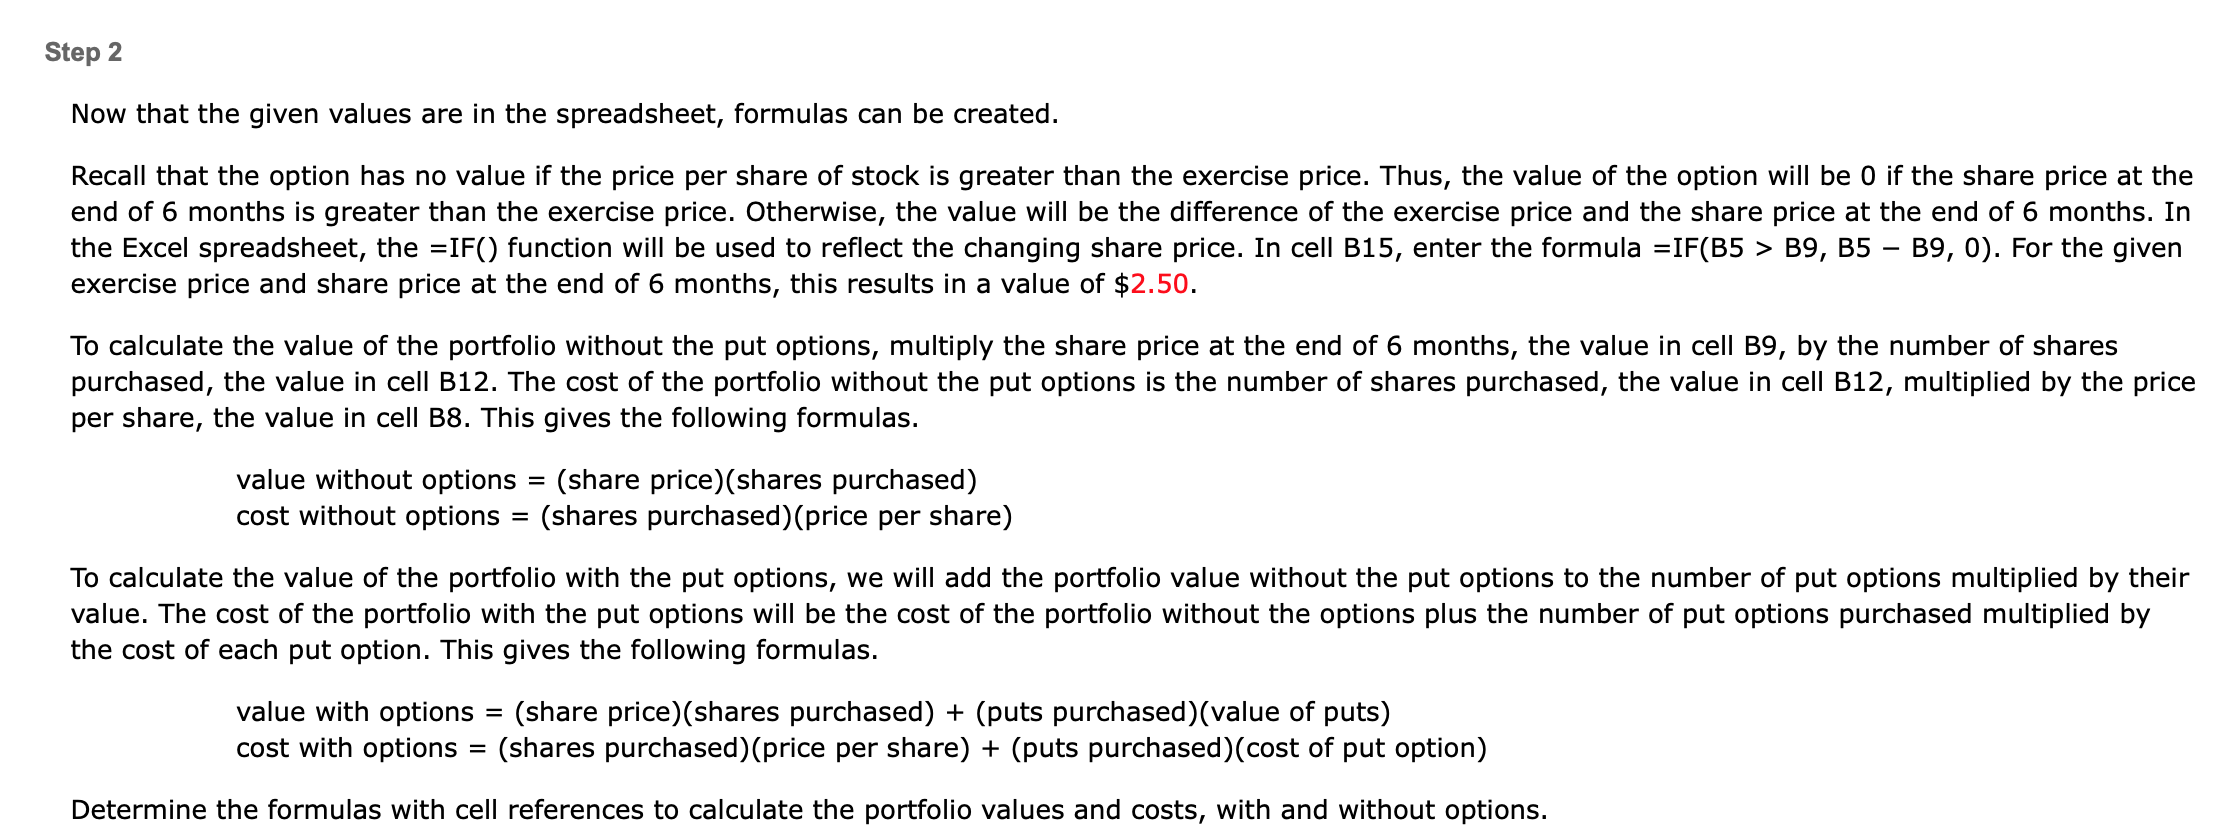
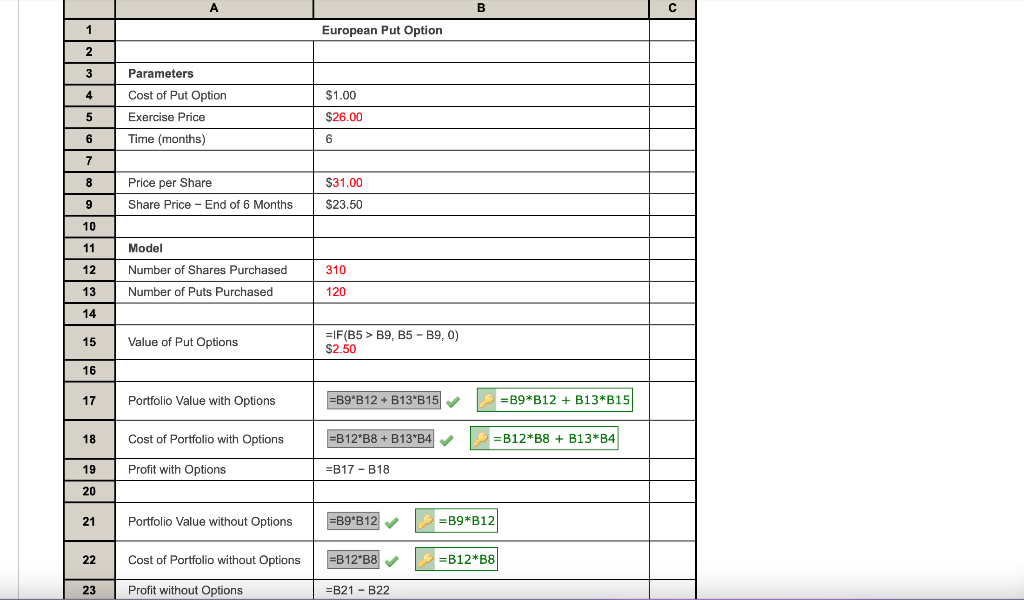
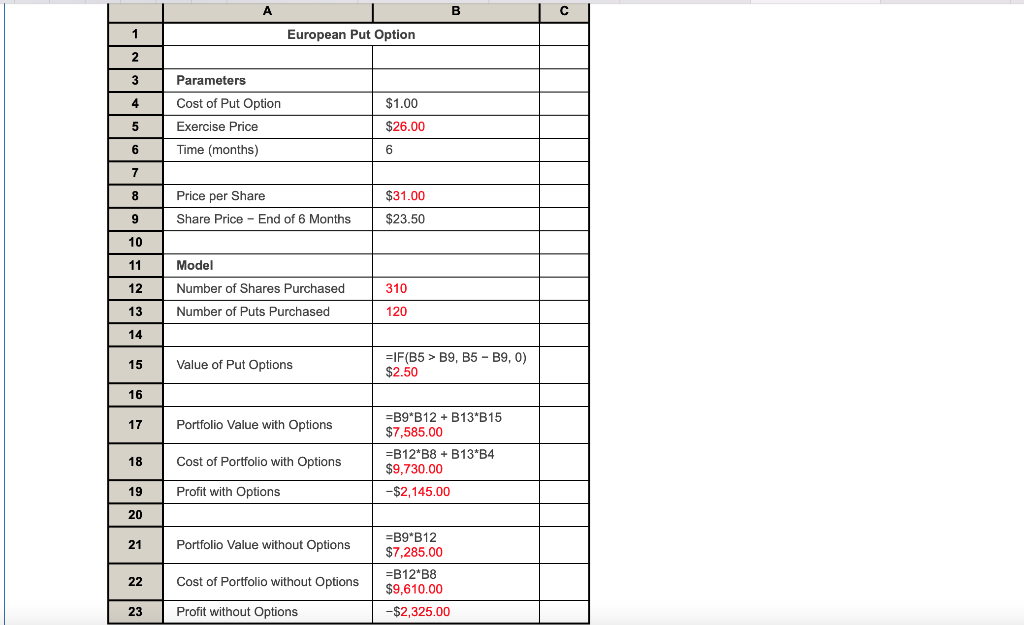
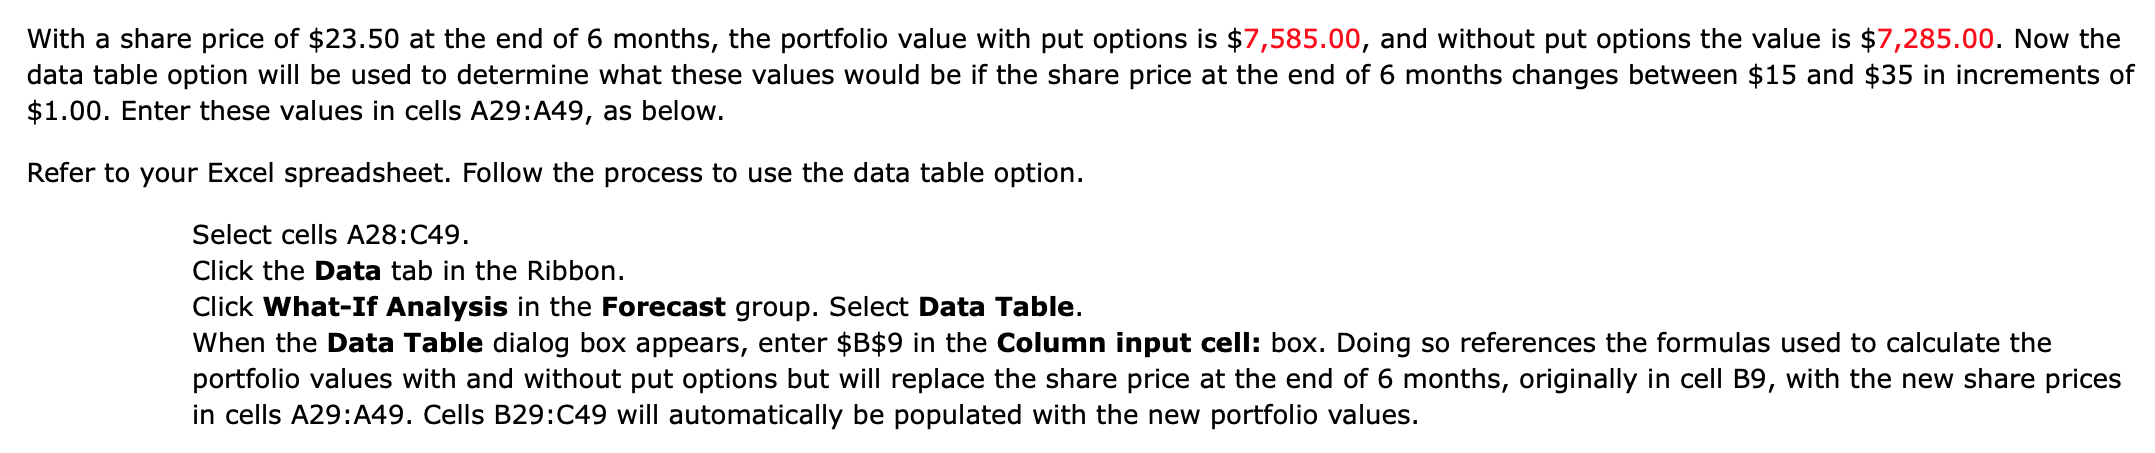
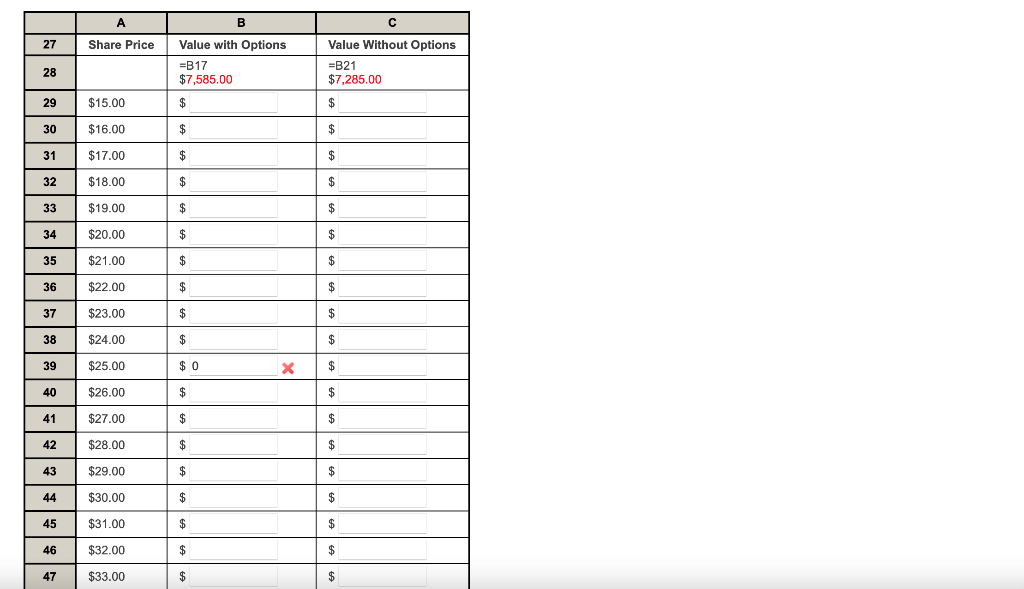
(a) Using data tables, construct a model that shows the value of the portfolio with options and without options for a share price in six months between $15 and $35 per share in increments of $1.00. Constructing data tables using Excel is a quick way to calculate expressions by substituting different values for one of the terms within a formula. Before using the data table option, a spreadsheet of values and formulas must be constructed. Open an Excel spreadsheet and format it as below. First place the known values in the spreadsheet. The exercise price is given to be $26. At the end of 6 months, the price per share is $23.50. A total of 310 shares were purchased at $31 per share. In addition, 120 six-month European put options were purchased for $1 each. Place these values in the spreadsheet below. Now that the given values are in the spreadsheet, formulas can be created. Recall that the option has no value if the price per share of stock is greater than the exercise price. Thus, the value of the option will be 0 if the share price at the end of 6 months is greater than the exercise price. Otherwise, the value will be the difference of the exercise price and the share price at the end of 6 months. In the Excel spreadsheet, the =IF() function will be used to reflect the changing share price. In cell B15, enter the formula =IF(B5 > B9, B5 - B9, 0 ). For the given exercise price and share price at the end of 6 months, this results in a value of $2.50. To calculate the value of the portfolio without the put options, multiply the share price at the end of 6 months, the value in cell B9, by the number of purchased, the value in cell B12. The cost of the portfolio without the put options is the number of shares purchased, the value in cell B12, multiplied by the price per share, the value in cell B8. This gives the following formulas. value without options =( share price )( shares purchased ) cost without options =( shares purchased )( price per share ) To calculate the value of the portfolio with the put options, we will add the portfolio value without the put options to the number of pution mied by the value. The cost of the portfolio with the put options will be the cost of the portfolio without the options plus the number of putions purchased mulied by the cost of each put option. This gives the following formulas. value with options = (share price) ( shares purchased )+ (puts purchased)(value of puts) cost with options = (shares purchased)(price per share) + (puts purchased)(cost of put option) Determine the formulas with cell references to calculate the portfolio values and costs, with and without options. With a share price of $23.50 at the end of 6 months, the portfolio value with put options is $7,585.00, and without put options the value is $7,285.00. Now the data table option will be used to determine what these values would be if the share price at the end of 6 months changes between $15 and $35 increments of $1.00. Enter these values in cells A29:A49, as below. Refer to your Excel spreadsheet. Follow the process to use the data table option. Select cells A28:C49. Click the Data tab in the Ribbon. Click What-If Analysis in the Forecast group. Select Data Table. When the Data Table dialog box appears, enter $B$9 in the Column input cell: box. Doing so references the formulas used to cale portfolio values with and without put options but will replace the share price at the end of 6 months, originally in cell B9, with the new share prices in cells A29:A49. Cells B29:C49 will automatically be populated with the new portfolio values