Question
this is a multi part case study question please solve it and provide all calculations and formulae and relevant information such as references as asked
this is a multi part case study question please solve it and provide all calculations and formulae and relevant information such as references as asked in the question, thank you!
For your coursework, you are required to answer the following four questions listed below. Please note all questions are compulsory. The total marks that can be awarded are allocated next to each sub-question.
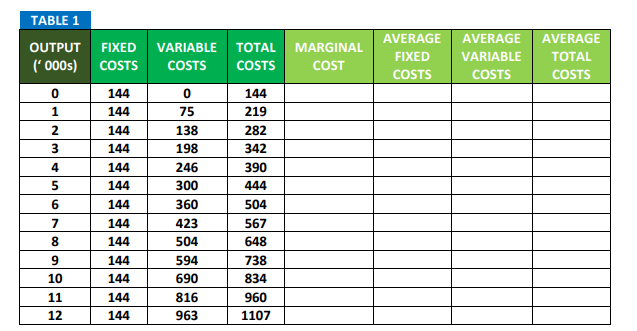
QUESTION 1 To make profit-maximising decisions the firms need to know how the costs vary with output. A firms cost rises as it increases with output. A firm cannot vary some of its inputs, such as capital, in the shortrun. Take a look at the following Table 1 which describes one firm in a competitive market. The values are in Euros (000s).

Question 1A: Fill-in Table 1. There is an Excel version of Table 1 [5 marks]
Question 1B: Illustrate graphically (Diagram 1B) the Fixed Costs (FC), Variable Costs (VC) and Total Cost (TC). Include zero output as the starting axes point. [5 marks]
Question 1C: Illustrate graphically (Diagram 1C) the Marginal Cost, the Average Fixed Cost (AFC), Average Variable Cost (AVC) and Average Total Cost (ATC). Include zero output as the starting axes point [5 marks]
Question 1D: Discuss any points of interest regarding Diagram 1C. Does Diagram 1C is in line with the theoretical predictions? What is the relationship between Marginal Cost (MC) and Average Total Cost (ATC) and the relationship between Marginal Cost (MC) and Average Variable Cost (AVC) [20 marks]
Question 1E: Critically evaluate the concept of cost in economics (opportunity cost). Can we observe opportunity costs? [10 marks]
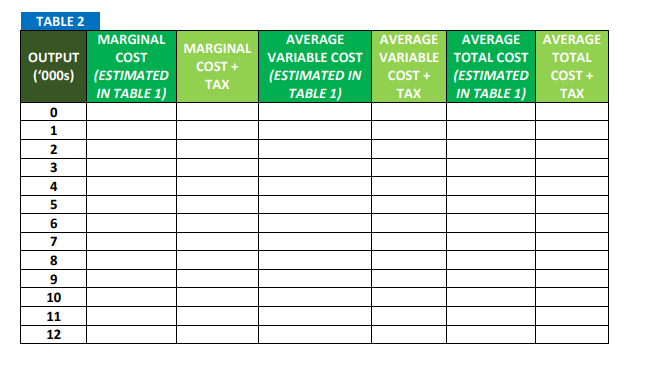
QUESTION 2 However, the operations of the firms are subjected to changes and the costs change. Let us assume that the costs are increasing (due to imposition of tax or due to increase in raw material prices). Let us assume that the government collects a specific tax of 10 per unit of output from the firm. This tax which varies with output affects the firms average variable costs, average costs and marginal costs curves but not the fixed costs. Look at the following Table 2. The values are in Euros (000s).

Question 2A: Fill-in Table 2. There is an Excel version of Table 2 [5 marks]
Question 2B: Illustrate graphically (Diagram 2A) the Marginal Cost (MC), Marginal Costs after Tax (MC+Tax), Average Variable Cost (AVC) and Average Variable Cost after Tax (AVC+Tax). Include zero output as the starting axes point. [5 marks]
Question 2C: Illustrate graphically (Diagram 2B) the Marginal Cost (MC), Marginal Costs after Tax (MC+Tax), Average Total Cost (ATC) and Average Total Cost after Tax (ATC+Tax). Include zero output as the starting axes point. [5 marks]
Question 2D: Discuss the effect of Taxes on Costs and explain why there is no effect of Taxes on Fixed Costs. Does the output which minimises the ATC and the AVC has changed or not? Explain why. [15 marks]
QUESTION 3 For the most recent financial reporting period, a business domiciled in the UK has Revenue of 2,000,000 and Total Costs of 2,500,000 (=Total Fixed Costs: 1,000,000; Total Variable Costs: 1,500,000). The Net Loss on the firms Income Statement is reported as 500,000 (ignoring Tax Implications). The firm operated in a perfectly competitive market.
Question 3A: What decision should the firm make regarding operations over the short-term? [5 marks]
Question 3B: What decision should the firm make regarding operations over the long-term? [2 marks]
Question 3C: Assume the same business scenario except that Revenue is now 1,300,000, which creates a Net Loss of 1,200,000. What decision should the firm make regarding operations in this case? [3 marks]
QUESTION 4 In your critical evaluation do you think that the perfect competition exist in the real world? Justify your answer by employing references from official sources. [15 marks]
TABLE 1 AVERAGE AVERAGEAVERAGE FIXED VARIABLE TOTAL COSTS OUTPUT FIXED VARIABLE TOTAL MARGINAL (000s) COSTS COSTS COSTS COST 0 75 138 198 246 300 360 423 504 594 690 816 963 COSTS COSTS 0 144 144 144 144 144 144 144 144 144 144 144 144 144 144 219 282 342 390 6 504 567 648 738 834 960 1107 10 12 TABLE 2 MARGINAL AVERAGE AVERAGE AVERAGE OUTPUTCOST MARGINAL AVERAGE (ESTIMATED COST+V IN TABLE 1) COST VARIABLE COST VARIABLE TOTAL COST TOTAL ('000s) (ESTIMATED (ESTIMATED IN COST (ESTIMATED COST + TABLE 1) TAX IN TABLE1) TAX 2 4 5 6 7 09 il 12Step by Step Solution
There are 3 Steps involved in it
Step: 1

Get Instant Access to Expert-Tailored Solutions
See step-by-step solutions with expert insights and AI powered tools for academic success
Step: 2

Step: 3

Ace Your Homework with AI
Get the answers you need in no time with our AI-driven, step-by-step assistance
Get Started


