this is a question about investment research method, this table combined high value with high momentum and high value with low momentum, etc. I want to know hoot understand this table and what strategies are the best? 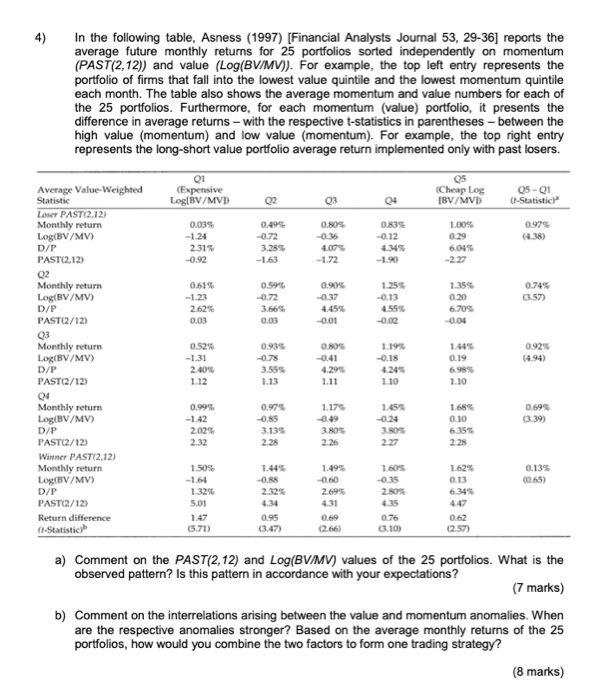
4) In the following table, Asness (1997) [Financial Analysts Journal 53, 29-36] reports the average future monthly returns for 25 portfolios sorted independently on momentum (PAST(2,12)) and value (Log(BV/MV)). For example, the top left entry represents the portfolio of firms that fall into the lowest value quintile and the lowest momentum quintile each month. The table also shows the average momentum and value numbers for each of the 25 portfolios. Furthermore, for each momentum (value) portfolio, it presents the difference in average returns - with the respective t-statistics in parentheses - between the high value (momentum) and low value (momentum). For example, the top right entry represents the long-short value portfolio average return implemented only with past losers. 01 (Expensive Log BV/MVD 02 03 Cheap Log IBV/MVD C 05-01 -Statistic) Average Value-Weighted Statistic Loser PAST(2.12) Monthly return Log(BV/MV) D/P PAST(2,12) 0.49% -0.72 0.80 -0.36 O. -0.12 0.039 -1.24 2.31% -0.92 1.00% 0.29 6.04% 0.97 (4.38) -1.72 -10 02 0.90 -037 0.74% (357) Monthly return Log(BV/MV) D/P PAST(2/12) 0.61% -123 2.62% 0.03 0.59 -0.72 3.665 0.03 1.25% -0.13 4.55% -0.02 1.35% 020 6.709 -0.04 -0.01 1.19% -0.18 0.925 (4.94) 0.19 Monthly return Log(BV/MV) D/P PAST(2/12) 0.52% -1.31 2.40% 1.12 0.93 -0.78 3.55% 1.13 0.80 -0.41 4.295 1.11 1.10 1.10 1.68% 0.699 39) 10 099 -1.42 2.02 2.32 0.97% -0.85 3.13% 2.28 1.17 -0.49 3.80% 2.26 1.45% -024 3.80 2.27 6.359 2.28 Monthly return Log(BV/MV) D/P PAST(2/12) Winner PAST/2.12) Monthly return Log BV/MV) D/P PAST(2/12) Return difference (-Statistic) 0.139 (0.65) 1.49% -0.60 2694 4.31 1.50 -1.64 1.32% 5.01 1.47 (5.71) 1.60% -0.35 2.80% 4.35 0.13 2.32% 4.07 095 (3.47) 0.69 266) 10) 0.62 (257) a) Comment on the PAST(2,12) and Log(BV/MV) values of the 25 portfolios. What is the observed pattern? Is this pattern in accordance with your expectations? (7 marks) b) Comment on the interrelations arising between the value and momentum anomalies. When are the respective anomalies stronger? Based on the average monthly returns of the 25 portfolios, how would you combine the two factors to form one trading strategy? (8 marks) 4) In the following table, Asness (1997) [Financial Analysts Journal 53, 29-36] reports the average future monthly returns for 25 portfolios sorted independently on momentum (PAST(2,12)) and value (Log(BV/MV)). For example, the top left entry represents the portfolio of firms that fall into the lowest value quintile and the lowest momentum quintile each month. The table also shows the average momentum and value numbers for each of the 25 portfolios. Furthermore, for each momentum (value) portfolio, it presents the difference in average returns - with the respective t-statistics in parentheses - between the high value (momentum) and low value (momentum). For example, the top right entry represents the long-short value portfolio average return implemented only with past losers. 01 (Expensive Log BV/MVD 02 03 Cheap Log IBV/MVD C 05-01 -Statistic) Average Value-Weighted Statistic Loser PAST(2.12) Monthly return Log(BV/MV) D/P PAST(2,12) 0.49% -0.72 0.80 -0.36 O. -0.12 0.039 -1.24 2.31% -0.92 1.00% 0.29 6.04% 0.97 (4.38) -1.72 -10 02 0.90 -037 0.74% (357) Monthly return Log(BV/MV) D/P PAST(2/12) 0.61% -123 2.62% 0.03 0.59 -0.72 3.665 0.03 1.25% -0.13 4.55% -0.02 1.35% 020 6.709 -0.04 -0.01 1.19% -0.18 0.925 (4.94) 0.19 Monthly return Log(BV/MV) D/P PAST(2/12) 0.52% -1.31 2.40% 1.12 0.93 -0.78 3.55% 1.13 0.80 -0.41 4.295 1.11 1.10 1.10 1.68% 0.699 39) 10 099 -1.42 2.02 2.32 0.97% -0.85 3.13% 2.28 1.17 -0.49 3.80% 2.26 1.45% -024 3.80 2.27 6.359 2.28 Monthly return Log(BV/MV) D/P PAST(2/12) Winner PAST/2.12) Monthly return Log BV/MV) D/P PAST(2/12) Return difference (-Statistic) 0.139 (0.65) 1.49% -0.60 2694 4.31 1.50 -1.64 1.32% 5.01 1.47 (5.71) 1.60% -0.35 2.80% 4.35 0.13 2.32% 4.07 095 (3.47) 0.69 266) 10) 0.62 (257) a) Comment on the PAST(2,12) and Log(BV/MV) values of the 25 portfolios. What is the observed pattern? Is this pattern in accordance with your expectations? (7 marks) b) Comment on the interrelations arising between the value and momentum anomalies. When are the respective anomalies stronger? Based on the average monthly returns of the 25 portfolios, how would you combine the two factors to form one trading strategy? (8 marks)