This is a research survey on monthly mobile phone bills in RM for female and male. Based on the results below, which data is normalized
This is a research survey on monthly mobile phone bills in RM for female and male. Based on the results below, which data is normalized and which data is not normalized? How to make sure data collection is normalized?
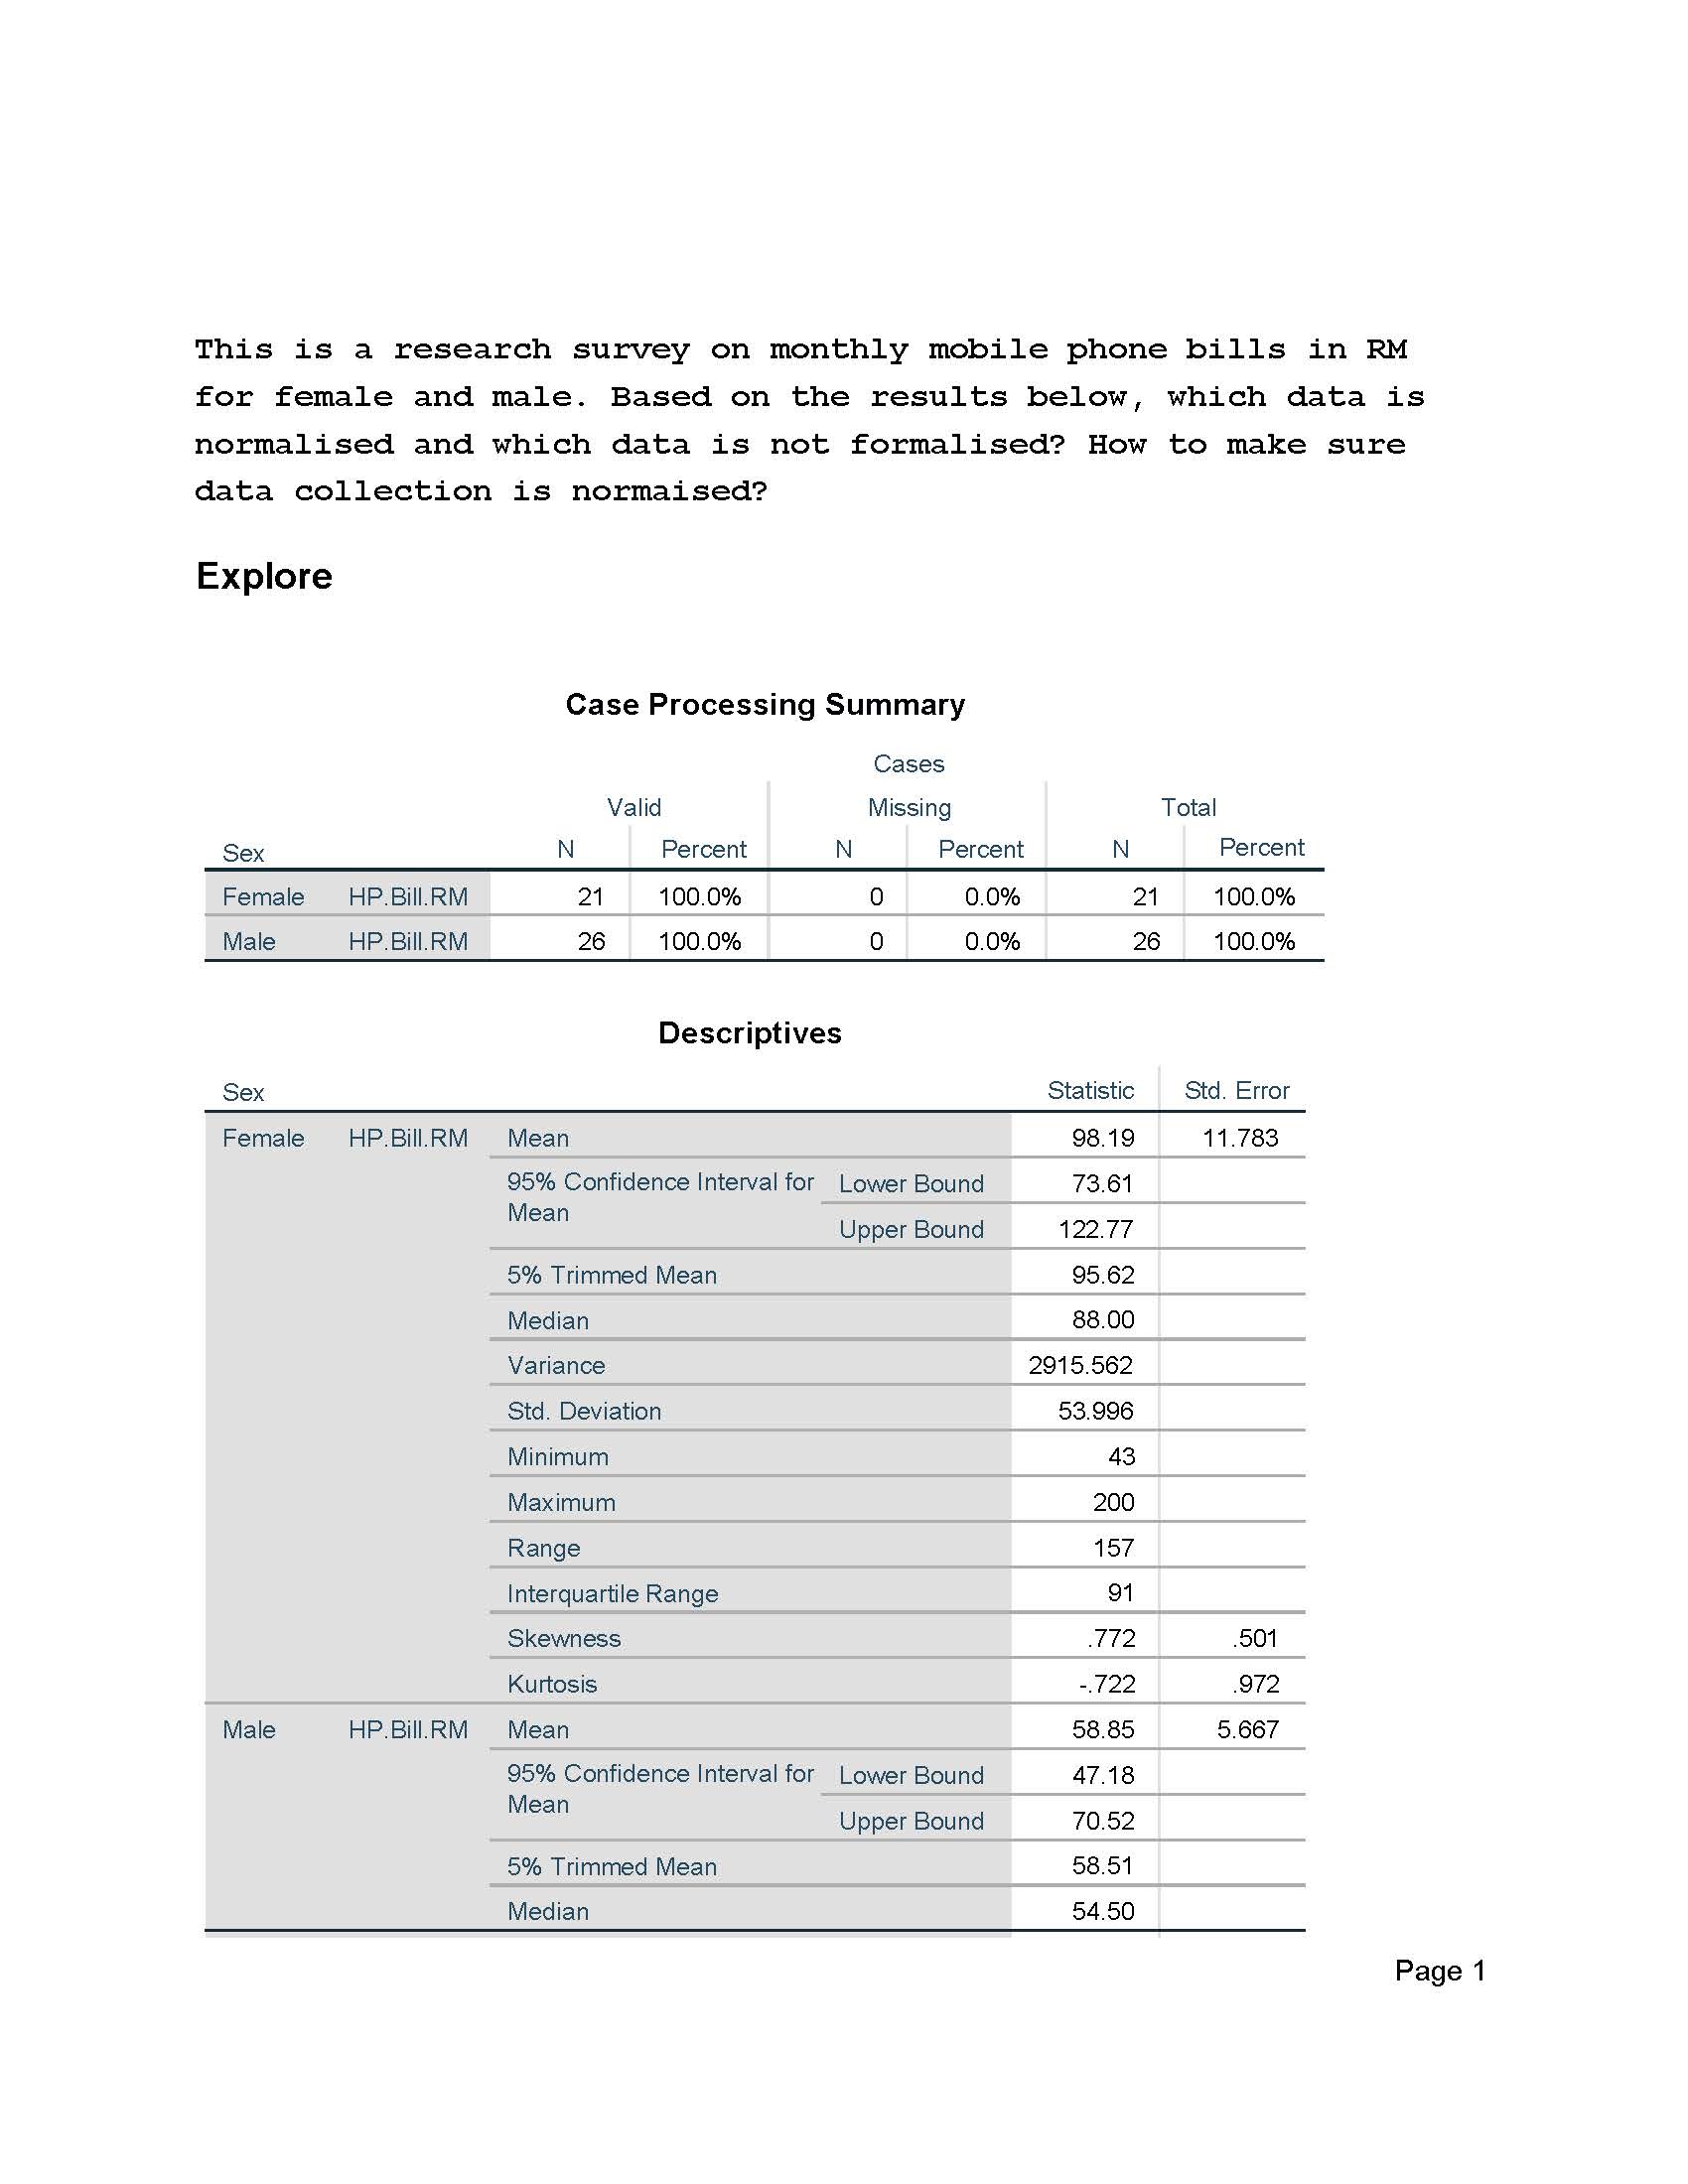
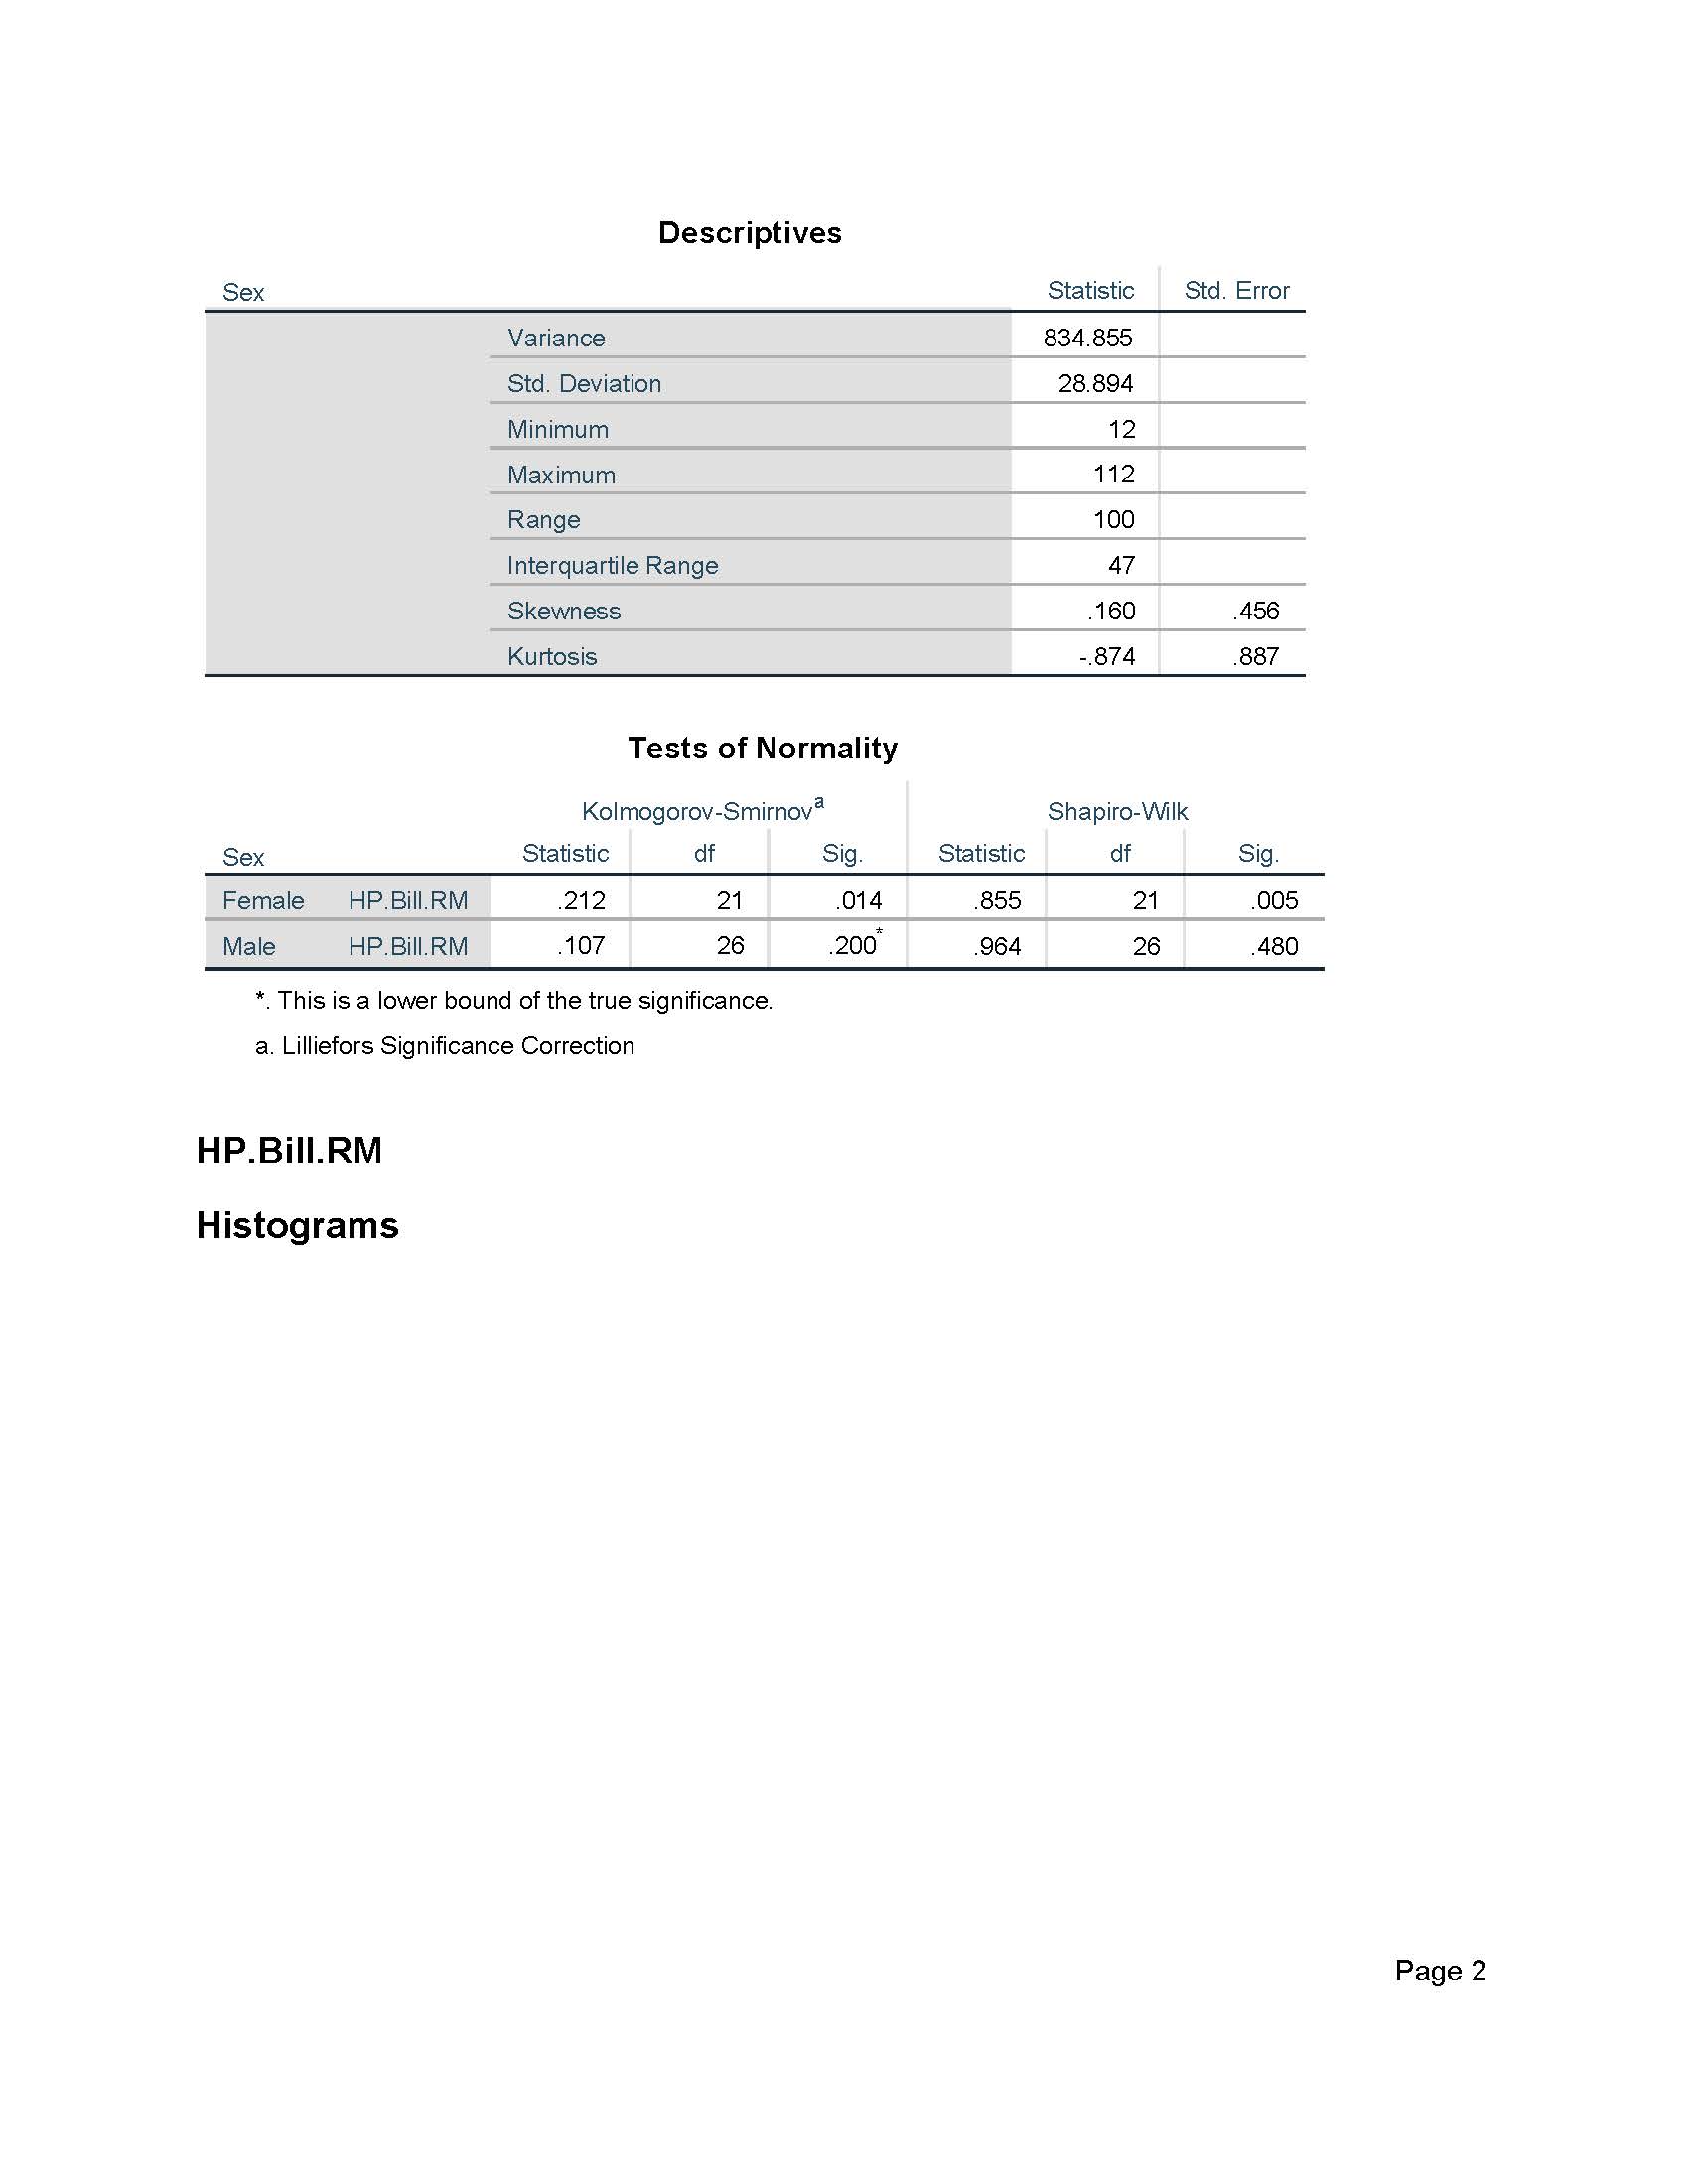
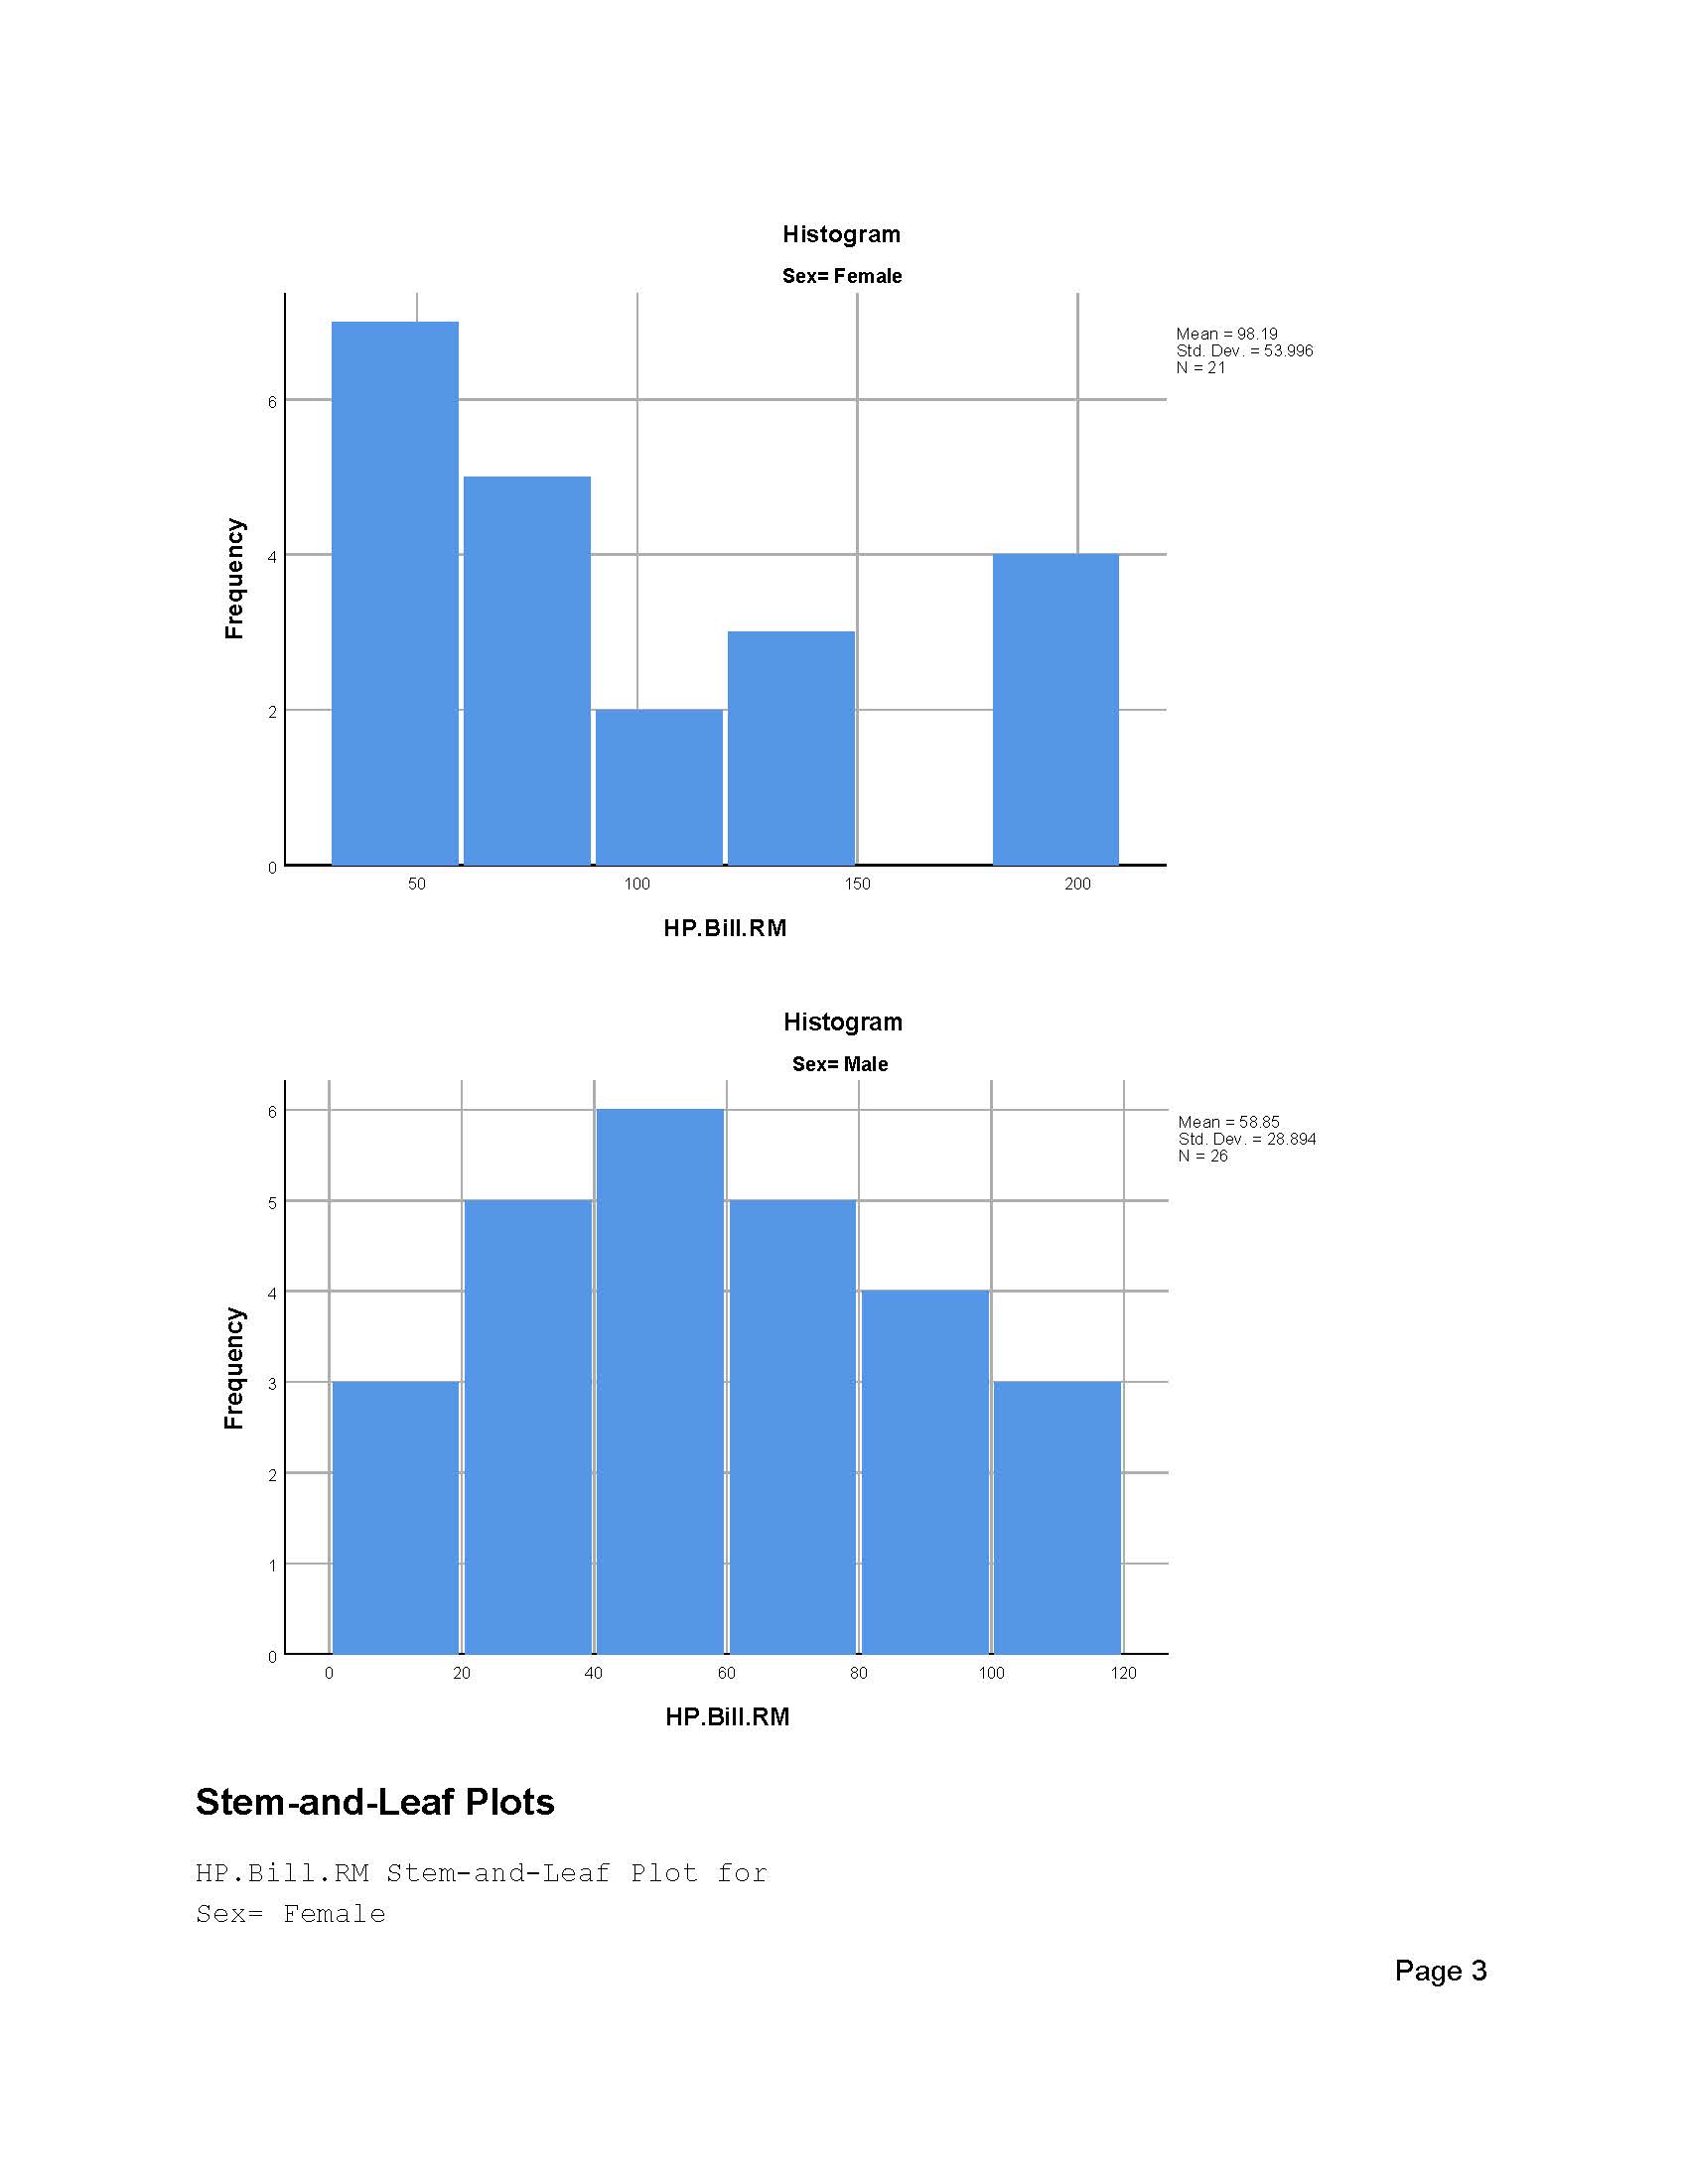
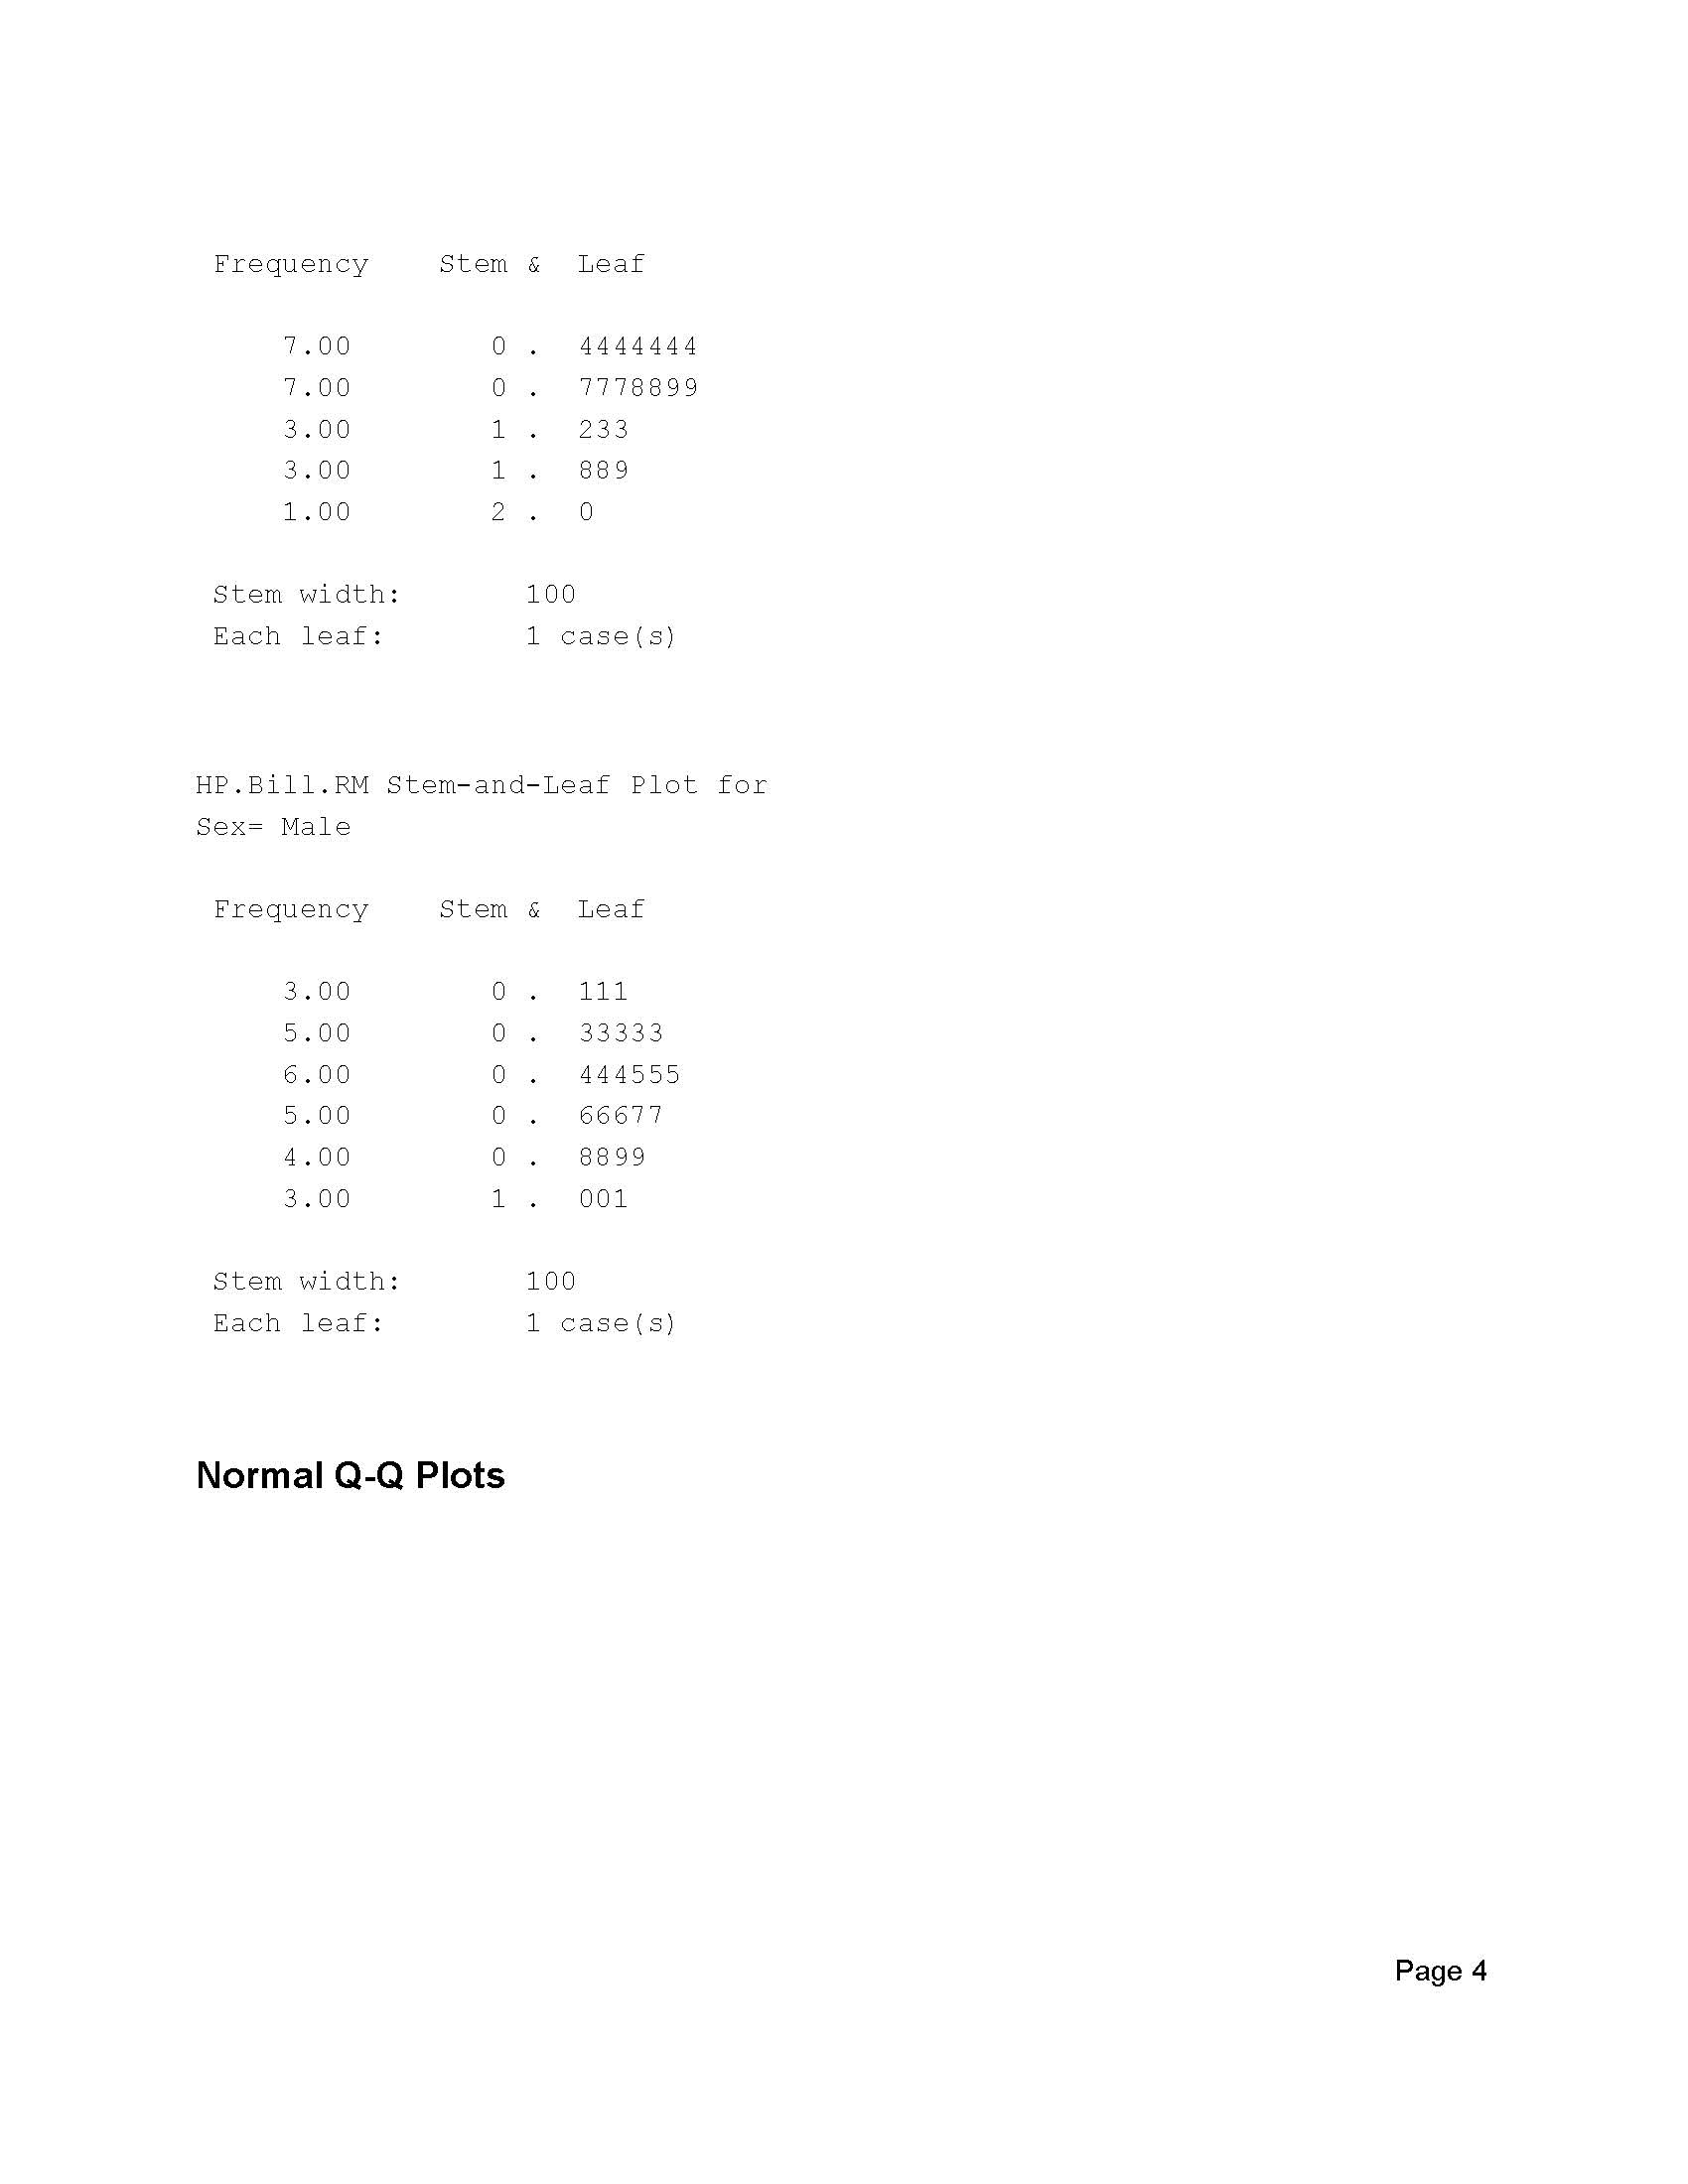
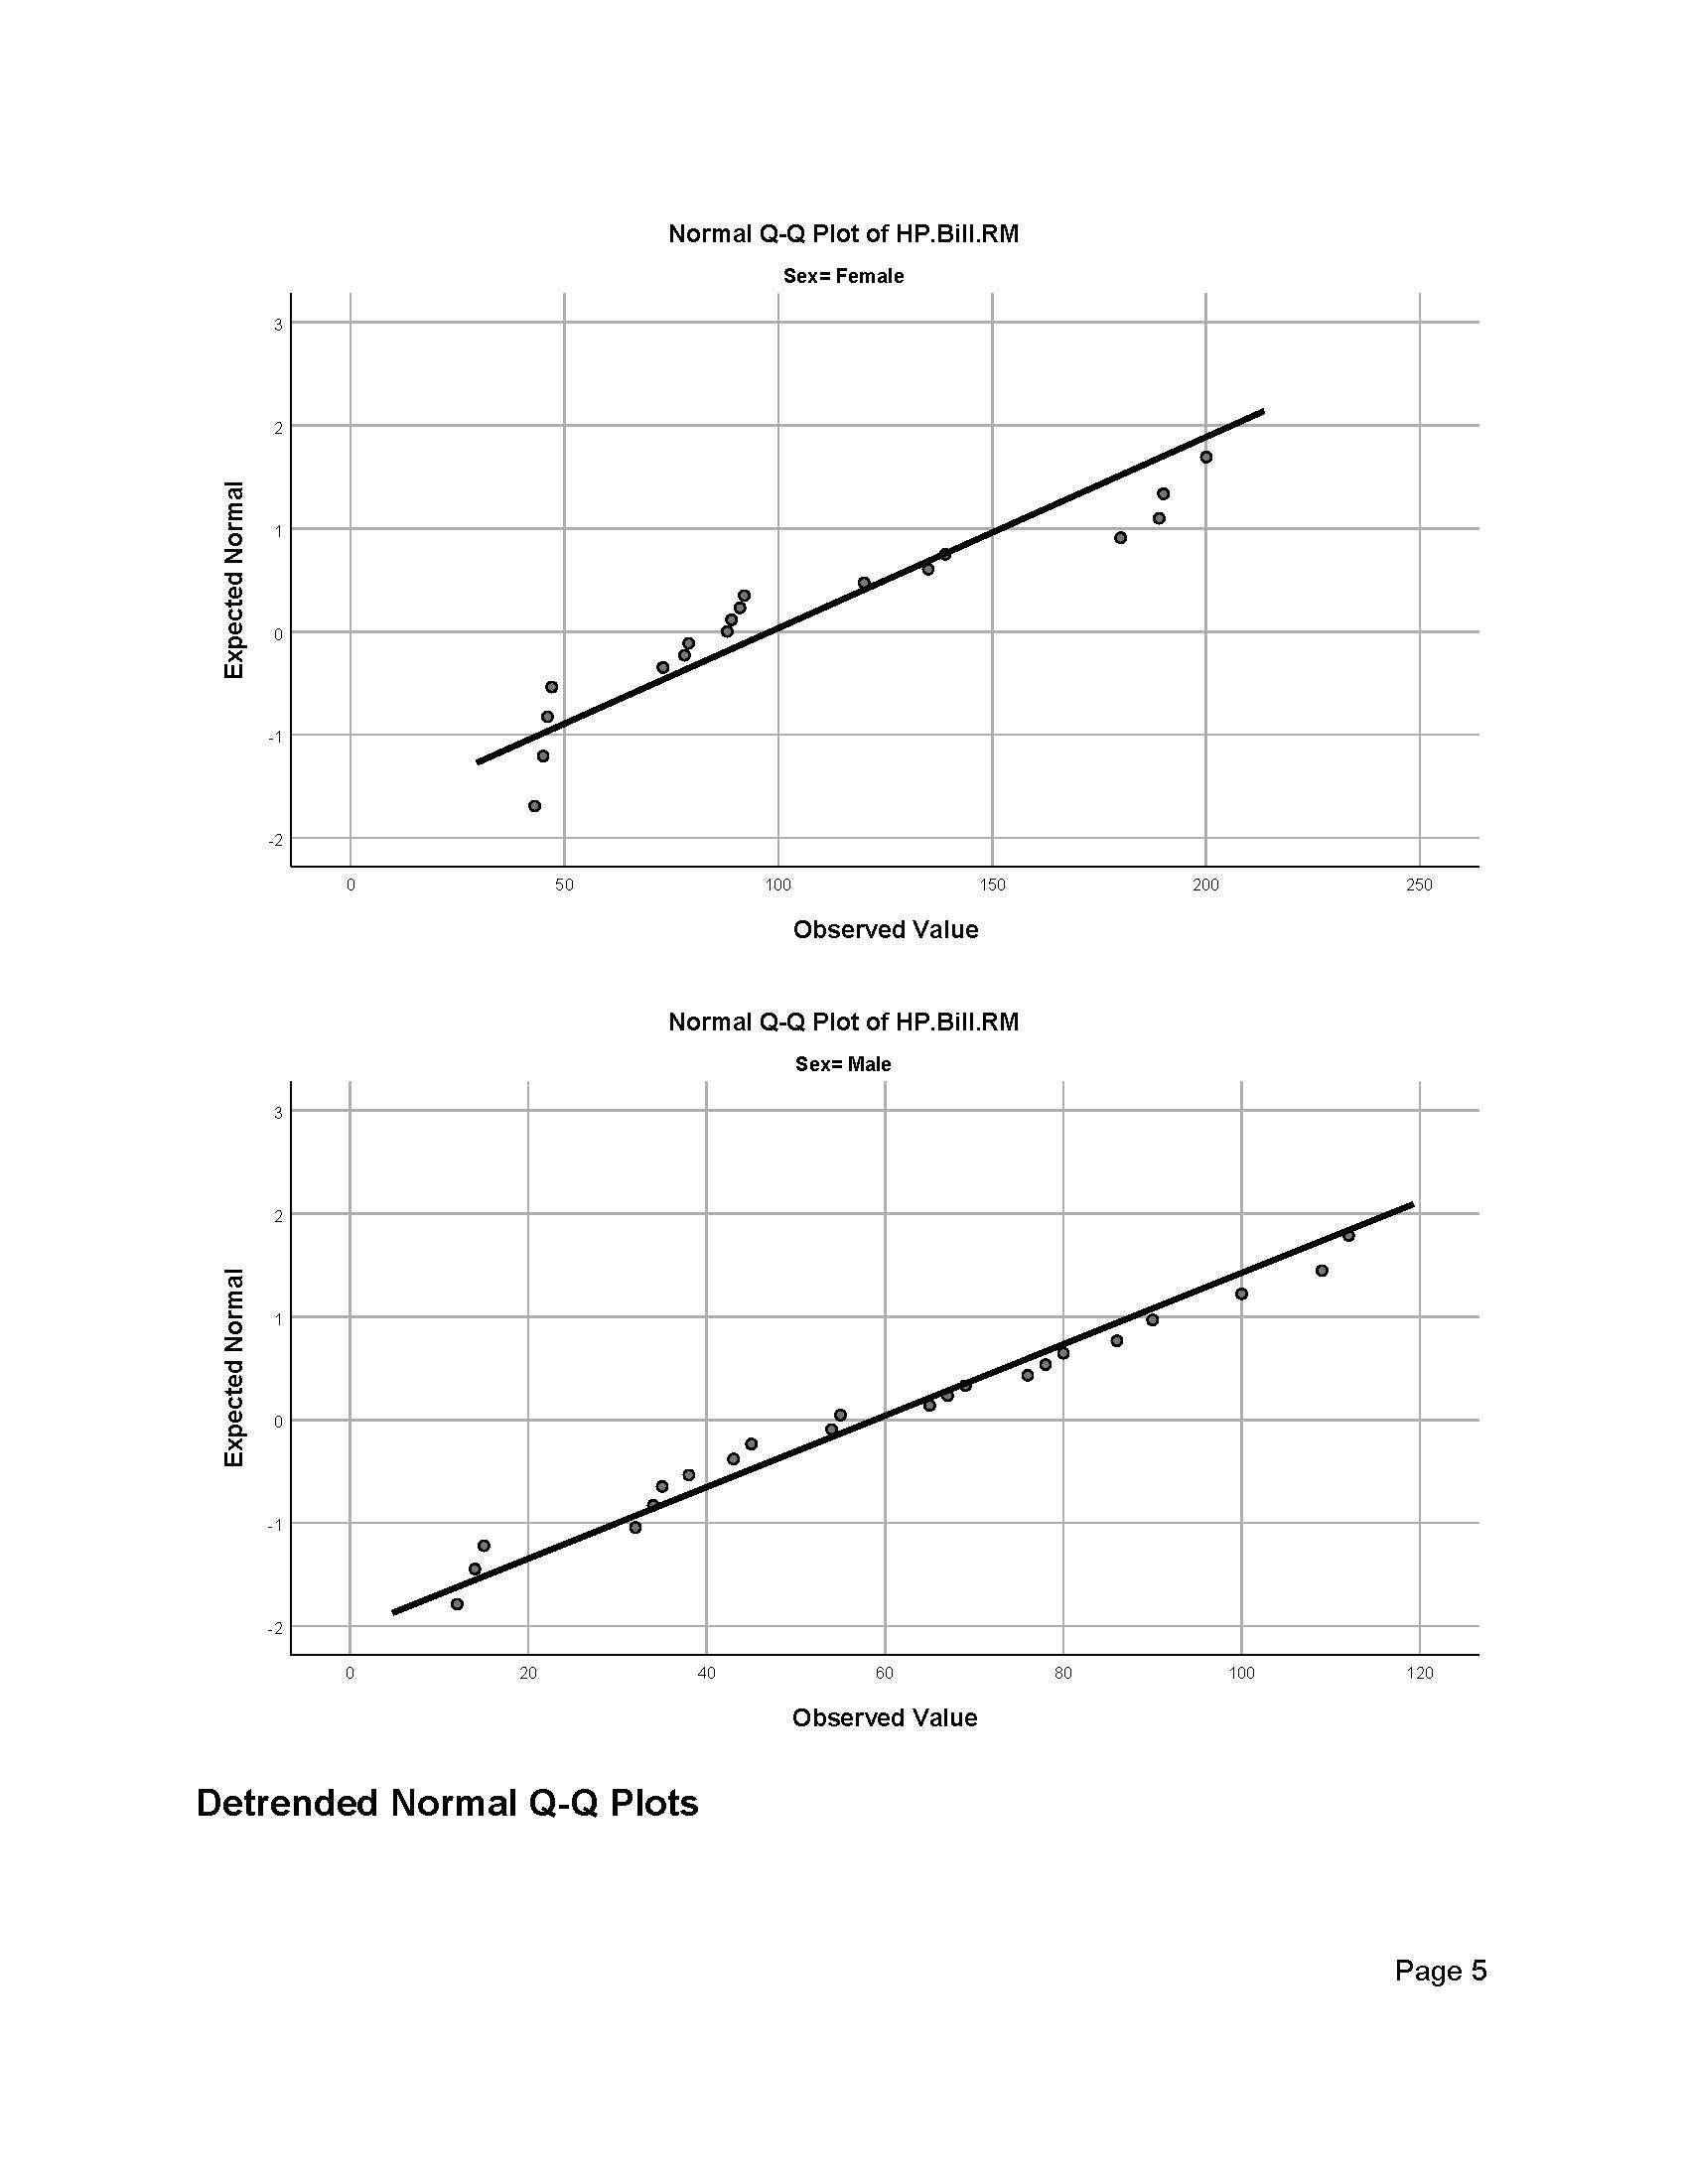
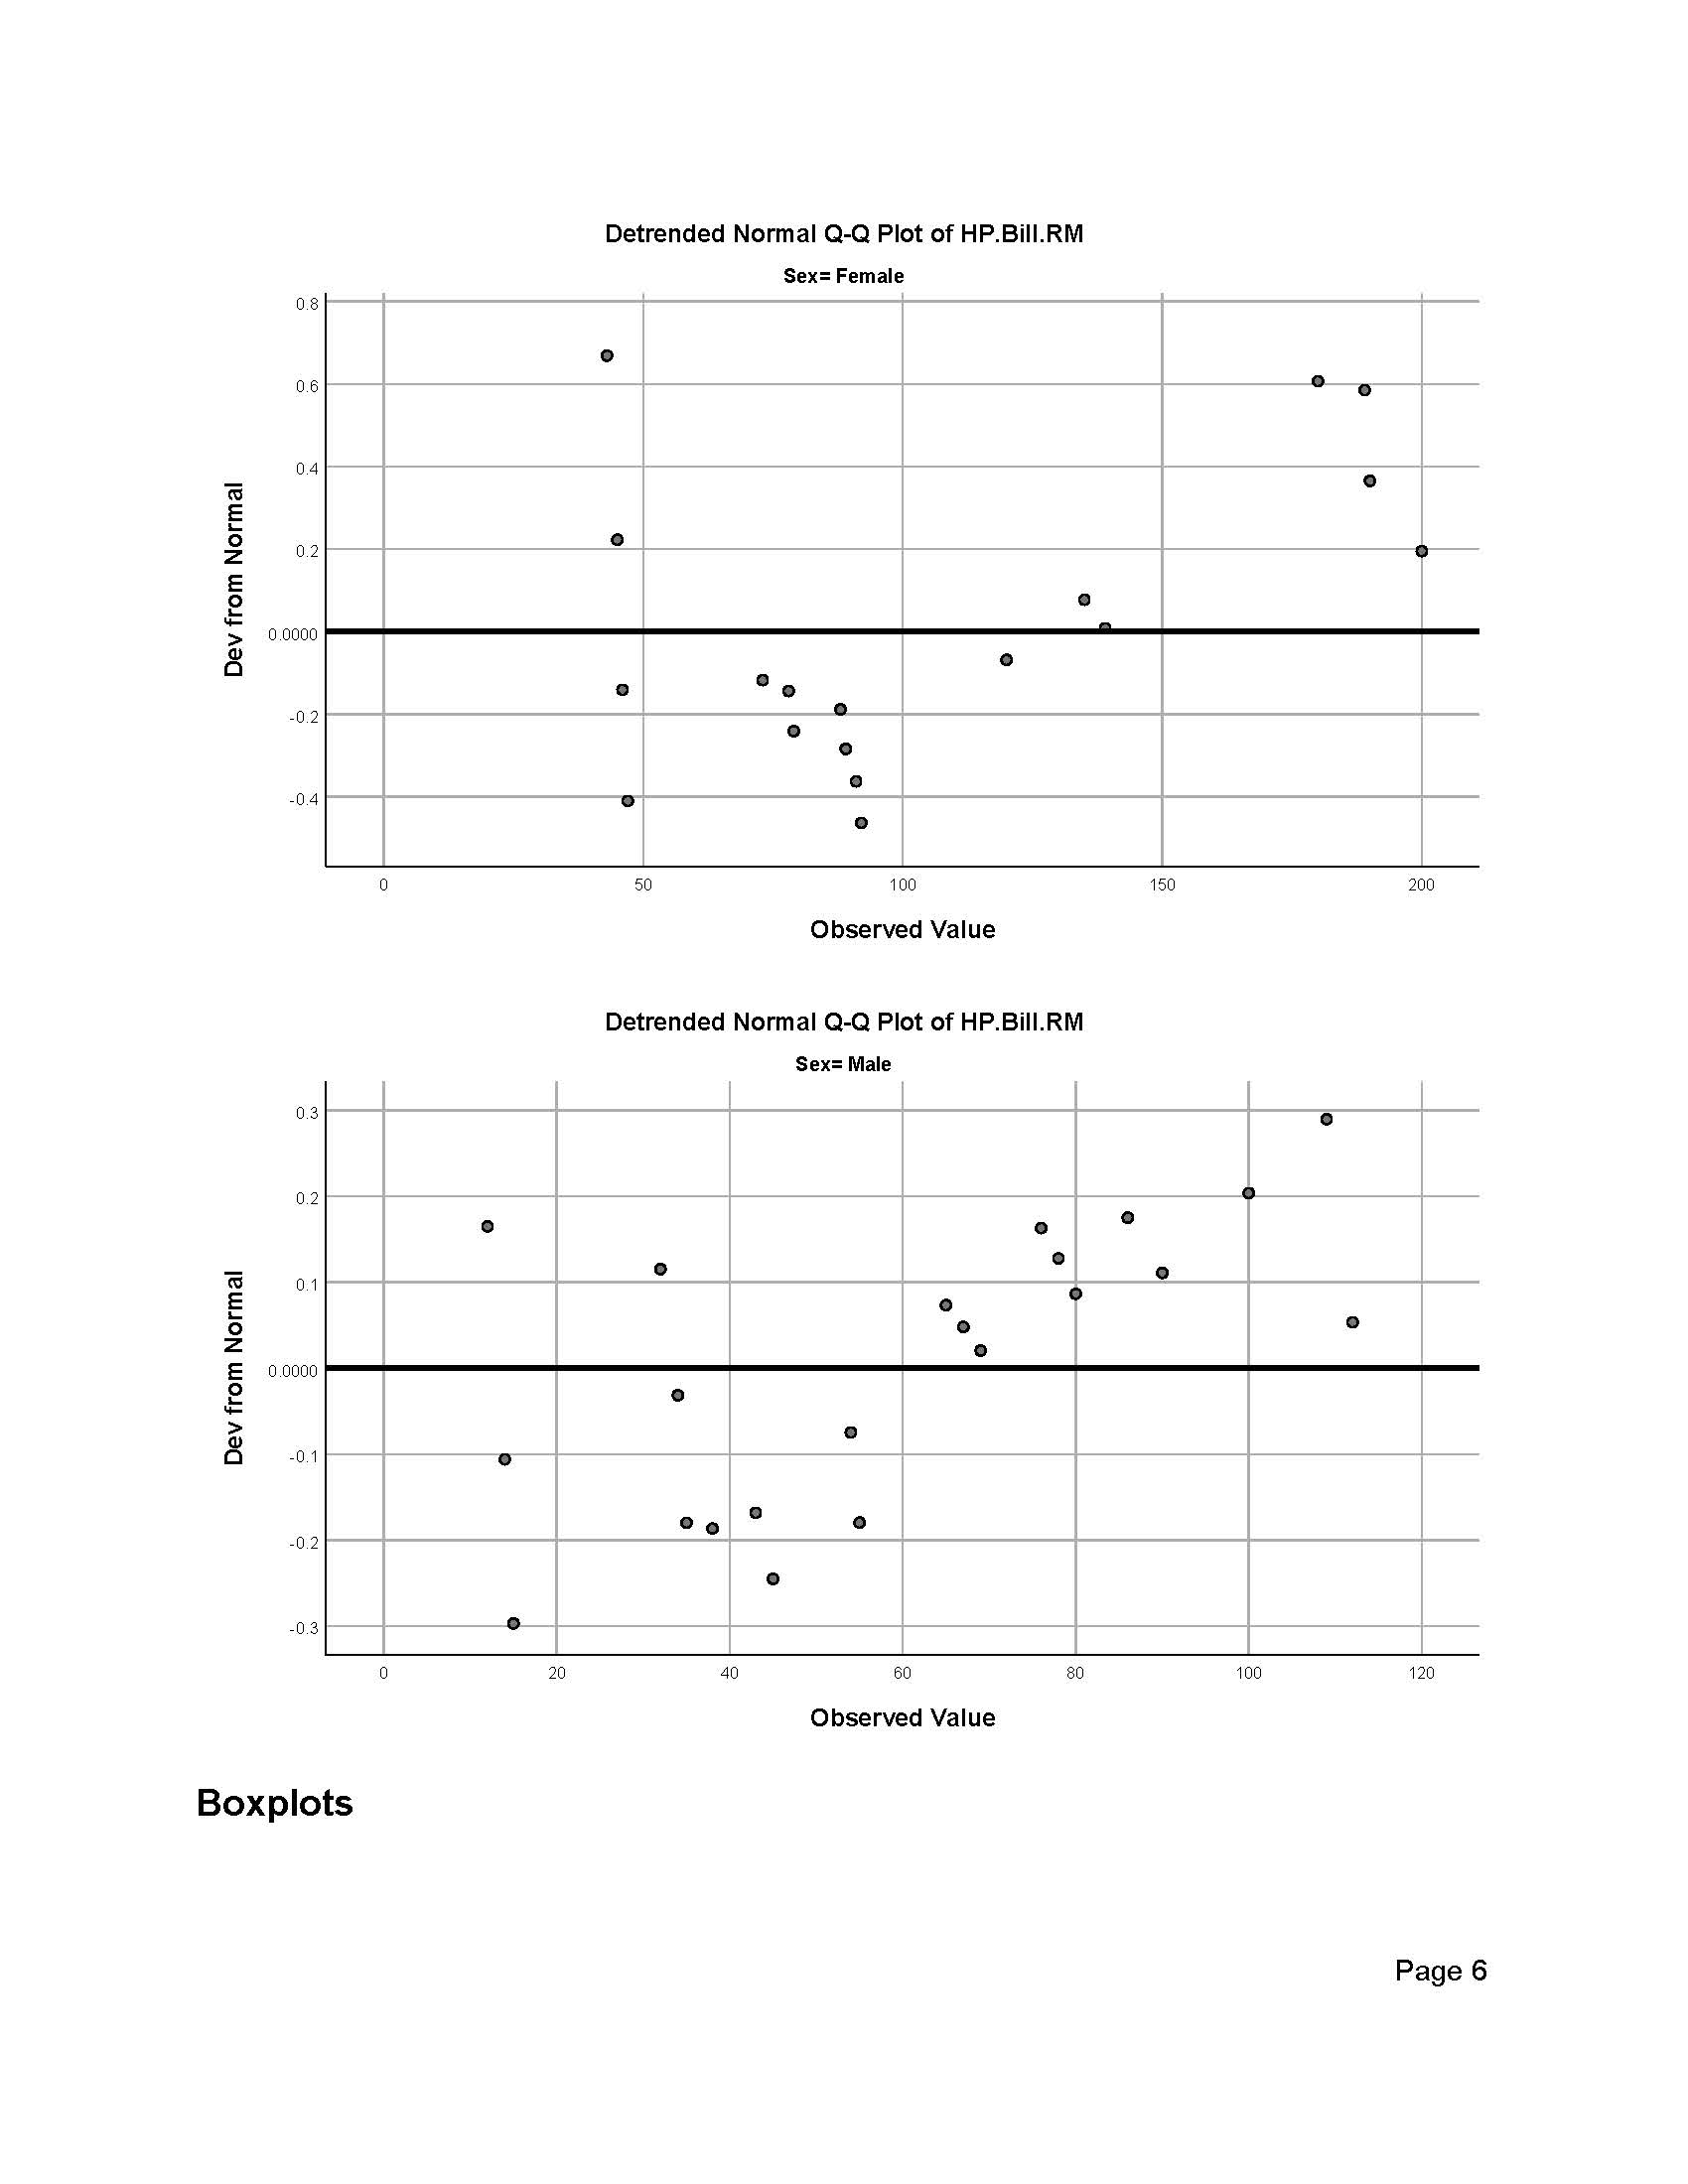
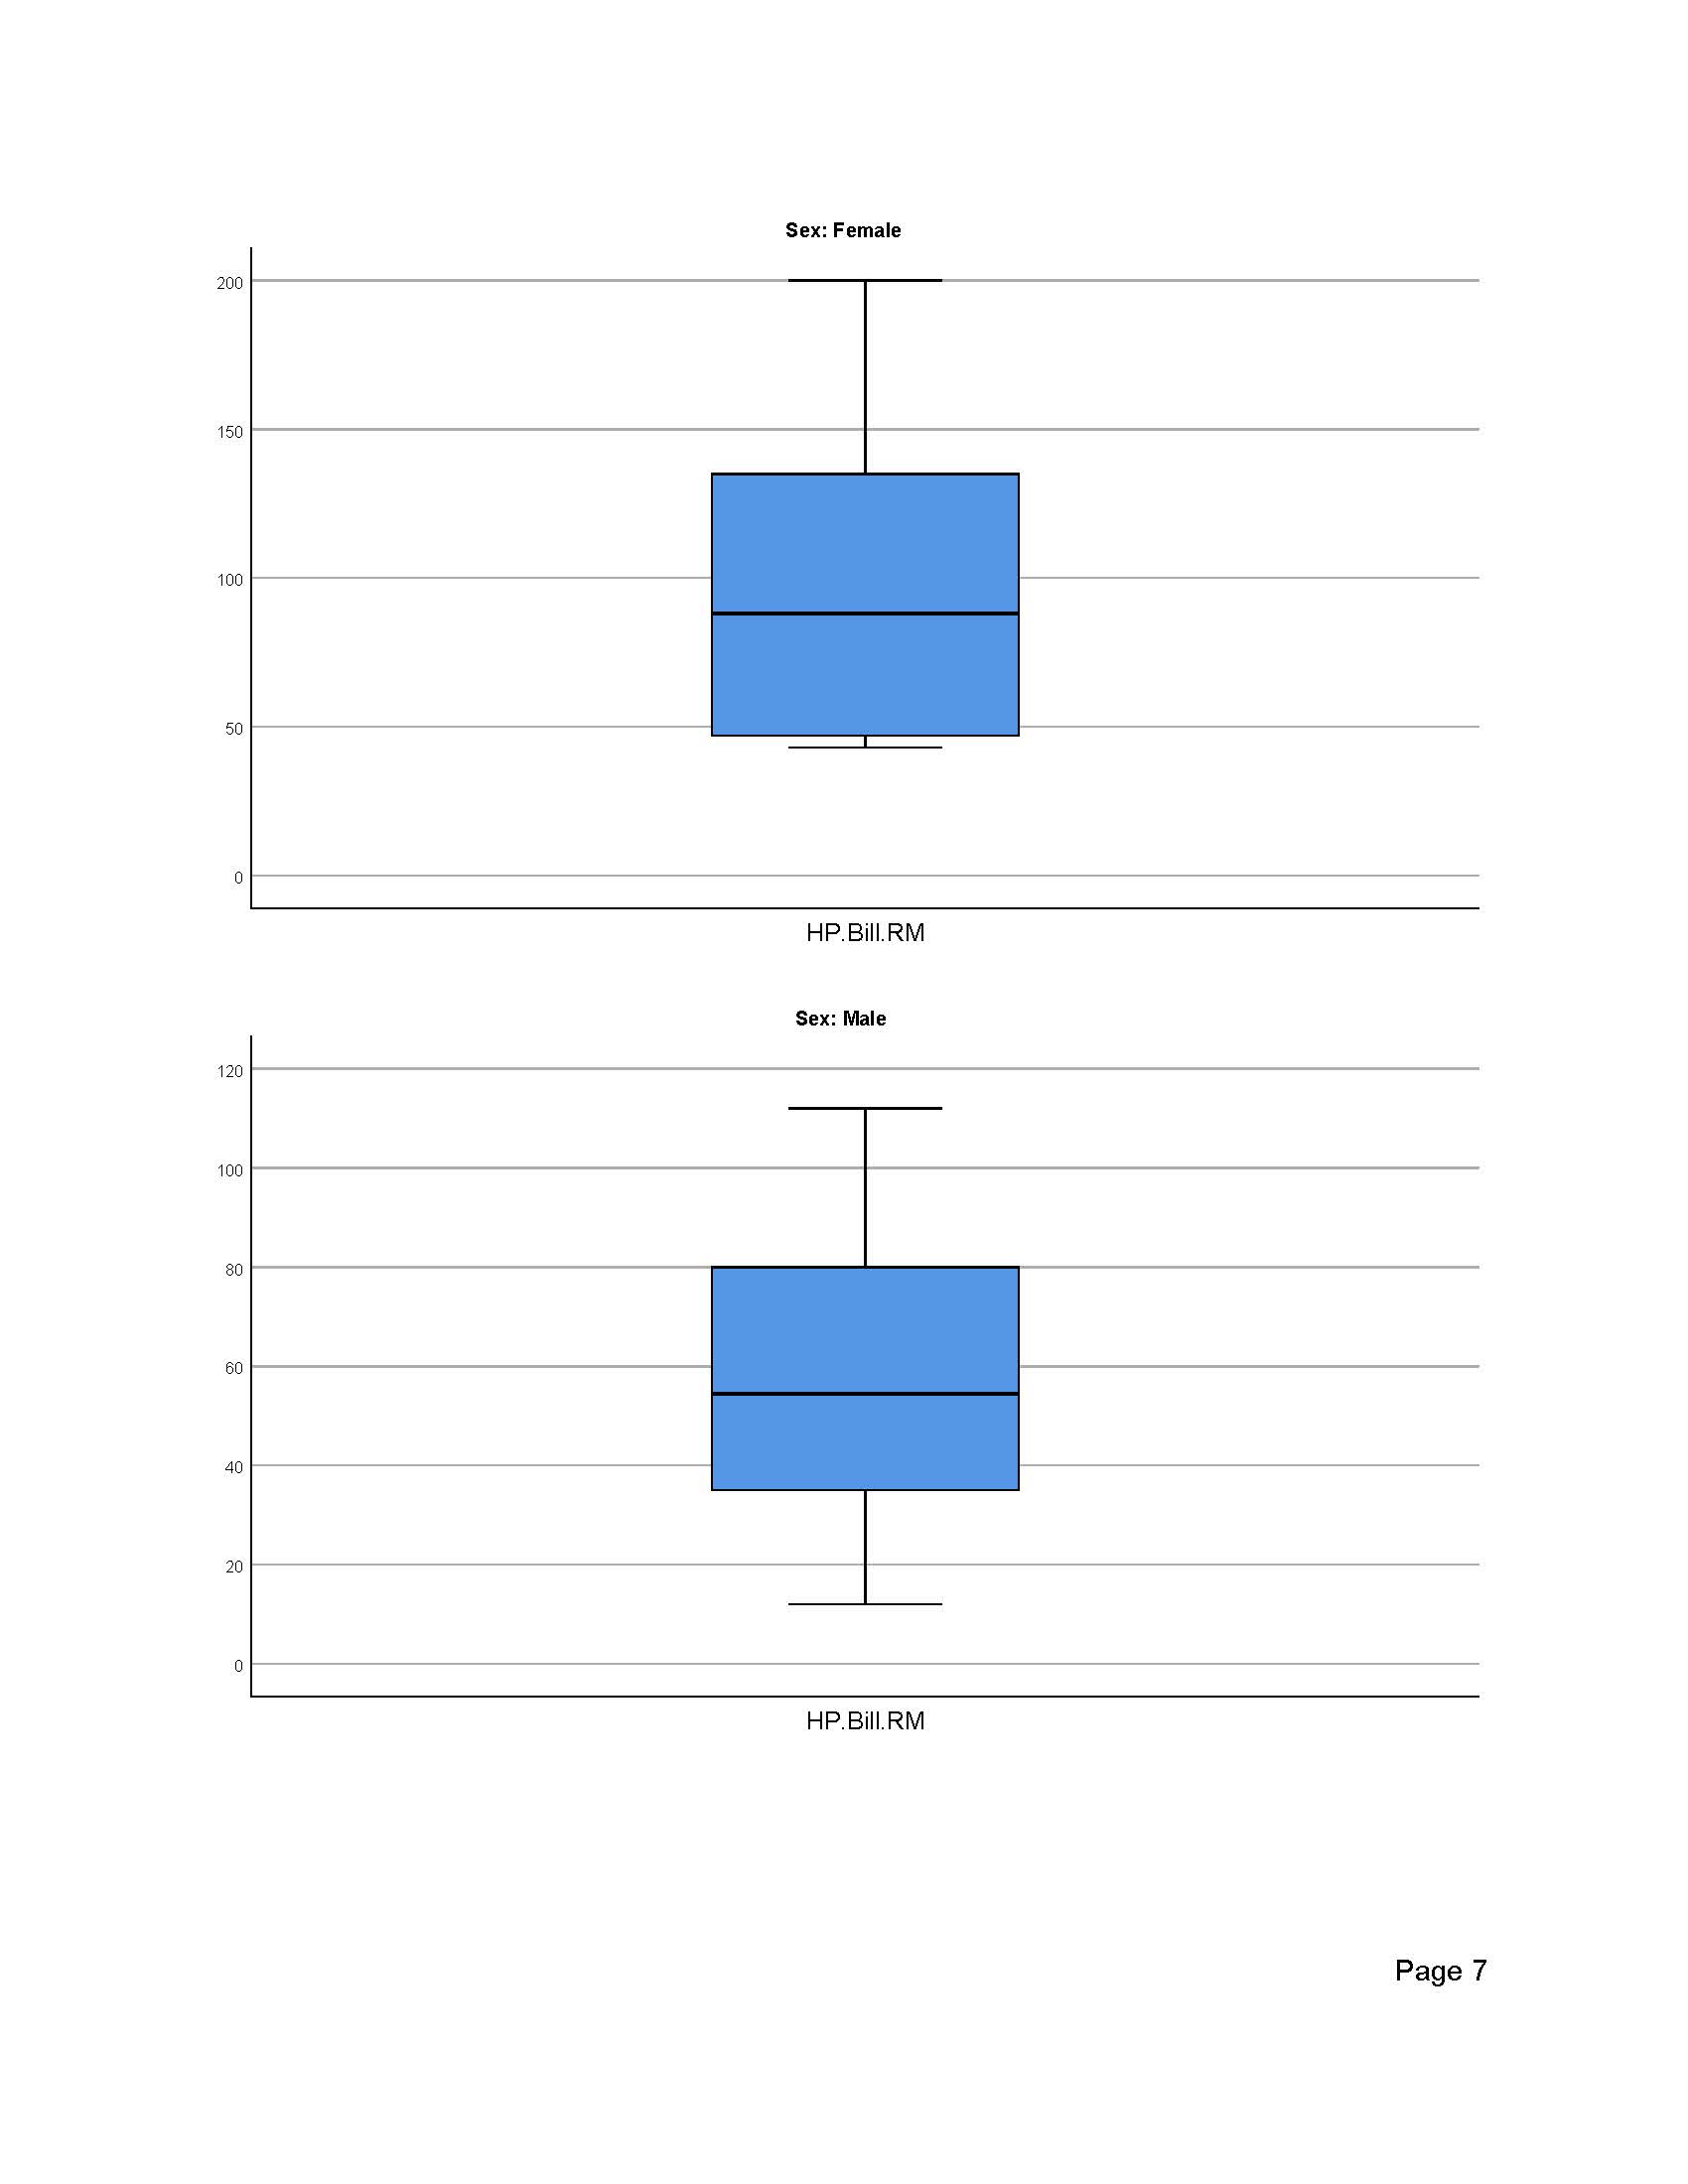
This is a research survey on monthly mobile phone bills in RM for female and male. Based on the results below, which data is normalised and which data is not formalised? How to make sure data collection is normaised? Explore Case Processing Summary Cases Valid Missing Total Sex N Percent N Percent N Percent Female HP. Bill.RM 21 100.0% 0 0.0% 21 100.0% Male HP. Bill.RM 26 100.0% 0.0% 26 100.0% Descriptives Sex Statistic Std. Error Female HP. Bill.RM Mean 98.19 11.783 95% Confidence Interval for Lower Bound 73.61 Mean Upper Bound 122.77 5% Trimmed Mean 95.62 Median 38.00 Variance 2915.562 Std. Deviation 53.996 Minimum 43 Maximum 200 Range 157 Interquartile Range 91 Skewness 772 501 Kurtosis .722 972 Male HP. Bill.RM Mean 58.85 5.667 95% Confidence Interval for Lower Bound 47.18 Mear Upper Bound 70.52 5% Trimmed Mean 58.51 Median 54.50 Page 1Descriptives Sex Statistic Std. Error Variance 834.855 Std. Deviation 28.894 Minimum 12 Maximum 112 Range 100 Interquartile Range 47 Skewness 160 456 Kurtosis -.874 887 Tests of Normality Kolmogorov-Smirnov Shapiro-Wilk Sex Statistic df Sig Statistic df Sig Female HP. Bill. RM 212 21 014 855 21 005 Male HP. Bill.RM .107 26 200 964 26 480 *. This is a lower bound of the true significance a. Lilliefors Significance Correction HP.Bill.RM Histograms Page 2Histogram Sex= Female Mean = 98. 19 Std. Dev. = 53.996 = 21 Frequency IN 50 100 150 200 HP. Bill.RM Histogram Sex= Male Mean = 58.85 Std. Dev . = 28.894 N = 26 Frequency N 20 40 60 80 100 120 HP.Bill.RM Stem-and-Leaf Plots HP . Bill . RM Stem-and-Leaf Plot for Sex= Female Page 3Frequency Stem & Leaf 7.00 O 4444444 7.00 7778899 3.00 1 23 3.00 889 1.00 2 0 Stem width: 100 Each leaf : 1 case (s) HP . Bill . RM Stem-and-Leaf Plot for Sex= Male Frequency Stem & Leaf 3. 00 0 111 5.00 0 33333 6.00 0 44 4555 5.00 66677 4.00 0 8899 3. 00 001 Stem width: 100 Each leaf : 1 case (s) Normal Q-Q Plots Page 4Normal Q-Q Plot of HP. Bill.RM Sex= Female N Expected Normal OoOO -1 50 100 150 200 250 Observed Value Normal Q-Q Plot of HP.Bill.RM Sex= Male 2 Expected Normal . .. -1 20 40 60 80 100 120 Observed Value Detrended Normal Q-Q Plots Page 5Detrended Normal Q-Q Plot of HP.Bill.RM Sex= Female 0.8 0.6 0.4 0 .2 O Dev from Normal 0.0000 O 50 100 150 200 Observed Value Detrended Normal Q-Q Plot of HP.Bill.RM Sex= Male 0.3 0.2 O 0.1 OL Dev from Normal 0.000 O -0.1 oo 0.2 20 40 60 80 100 120 Observed Value Boxplots Page 6Sex: Female 200 50 100 50 HP. Bill.RM Sex: Male 120 100 80 60 40 20 HP. Bill.RM Page 7
Step by Step Solution
There are 3 Steps involved in it
Step: 1
Get Instant Access to Expert-Tailored Solutions
See step-by-step solutions with expert insights and AI powered tools for academic success
Step: 2
Step: 3
Ace Your Homework with AI
Get the answers you need in no time with our AI-driven, step-by-step assistance