

Question: This is all I have for code so far. Problem 6: Batting Data - Home Runs In this problem, we will determine which Major League
This is all I have for code so far.
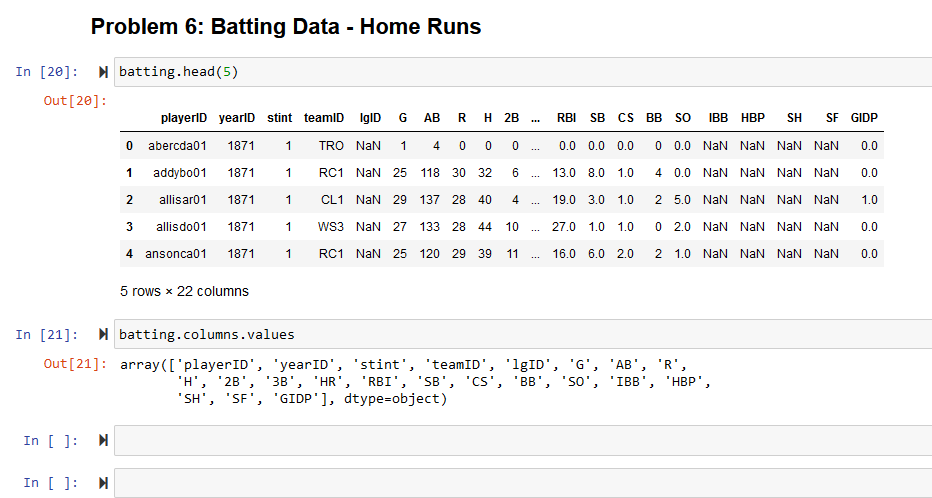
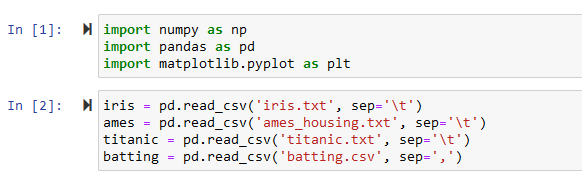
Problem 6: Batting Data - Home Runs In this problem, we will determine which Major League Baseball teams have had the most home runs in a single season, and which teams have had the highest lifetime average number of home runs per season. Use the head() method to display the first 5 rows of the batting DataFrame. We will now print the names of the columns in this DataFrame. Print batting.columns.values. We will now determine which MLB teams have the most home runs in a single season. Create a DataFrame named total_hr by selecting the teamID, yearID, and HR columns from batting, grouping the results by both teamID and yearID, and then summing the remaining column within each group. Sort the values by the total number of home runs, in descending order. When you call groupby( ) in this example, please set the optional as_index parameter to False. An explanation of this request is provided below. Use head () to display the first 10 rows of this DataFrame. When we perform grouping operations, the default behavior is for the columns that we are grouping on to be converted to indices, rather than actual columns. Setting as_index=False changes this behavior, and causes the columns on which we grouped to be added as regular columns. In the next cell, we will perform additional grouping steps that will require teamID and yearID to exist as regular columns. We will now determine which MLB teams have the highest average number of home runs per season. Create a DataFrame named avg_hr by selecting the teamID and HR columns from the total_hr DataFrame, grouping the results by teamID, and then averaging the remaining column within each group. Sort the values by the average number of home runs per season, in descending order. Use head() to display the first 10 rows of this DataFrame. \begin{tabular}{l|l} In [1]: M & importnumpyasnpimportpandasaspdimportmatplotlib.pyplotasplt \end{tabular} In [2]: N Problem 6: Batting Data - Home Runs Problem 6: Batting Data - Home Runs In this problem, we will determine which Major League Baseball teams have had the most home runs in a single season, and which teams have had the highest lifetime average number of home runs per season. Use the head() method to display the first 5 rows of the batting DataFrame. We will now print the names of the columns in this DataFrame. Print batting.columns.values. We will now determine which MLB teams have the most home runs in a single season. Create a DataFrame named total_hr by selecting the teamID, yearID, and HR columns from batting, grouping the results by both teamID and yearID, and then summing the remaining column within each group. Sort the values by the total number of home runs, in descending order. When you call groupby( ) in this example, please set the optional as_index parameter to False. An explanation of this request is provided below. Use head () to display the first 10 rows of this DataFrame. When we perform grouping operations, the default behavior is for the columns that we are grouping on to be converted to indices, rather than actual columns. Setting as_index=False changes this behavior, and causes the columns on which we grouped to be added as regular columns. In the next cell, we will perform additional grouping steps that will require teamID and yearID to exist as regular columns. We will now determine which MLB teams have the highest average number of home runs per season. Create a DataFrame named avg_hr by selecting the teamID and HR columns from the total_hr DataFrame, grouping the results by teamID, and then averaging the remaining column within each group. Sort the values by the average number of home runs per season, in descending order. Use head() to display the first 10 rows of this DataFrame. \begin{tabular}{l|l} In [1]: M & importnumpyasnpimportpandasaspdimportmatplotlib.pyplotasplt \end{tabular} In [2]: N Problem 6: Batting Data - Home Runs
Step by Step Solution
There are 3 Steps involved in it

Get step-by-step solutions from verified subject matter experts