Answered step by step
Verified Expert Solution
Question
1 Approved Answer
This is all one question! Please help thank you! 100% Normal text Courier New 13.5 + hala El 112 3 5 6 Enterprise Value/ Sales
 This is all one question!
Please help thank you!
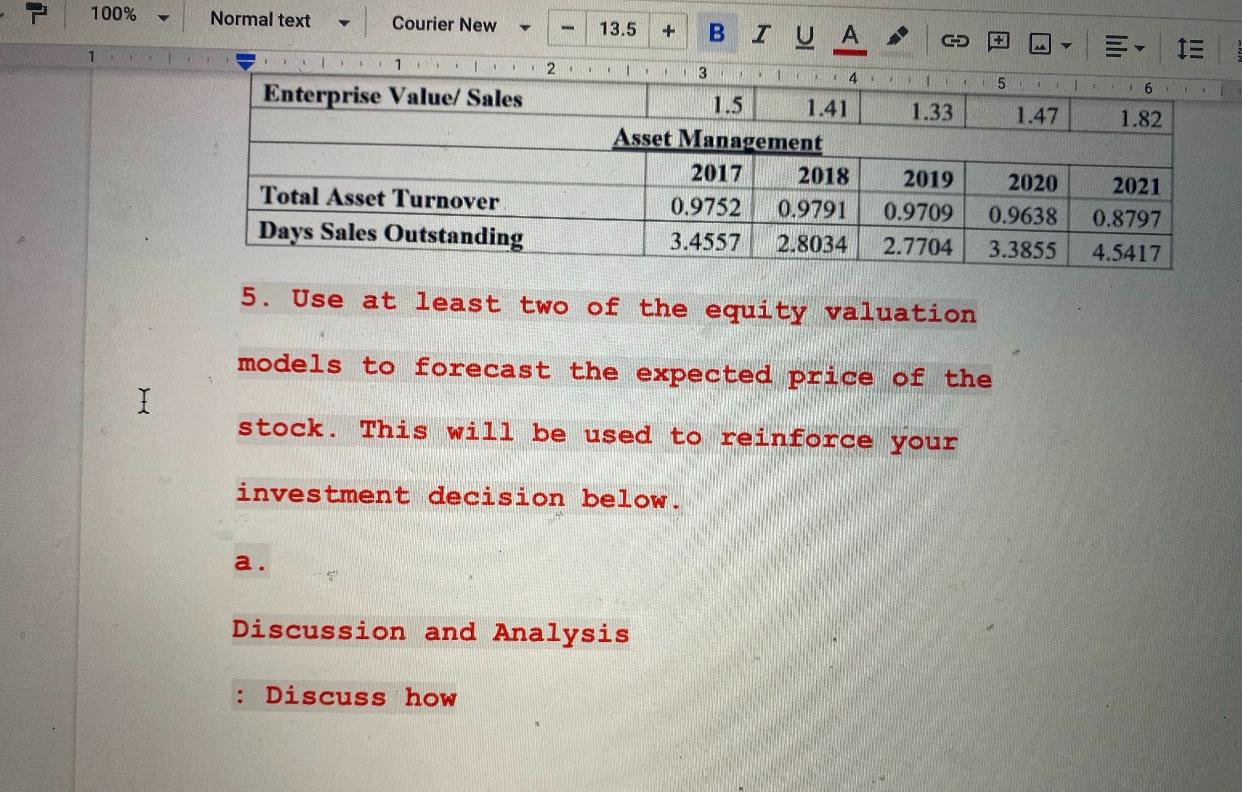
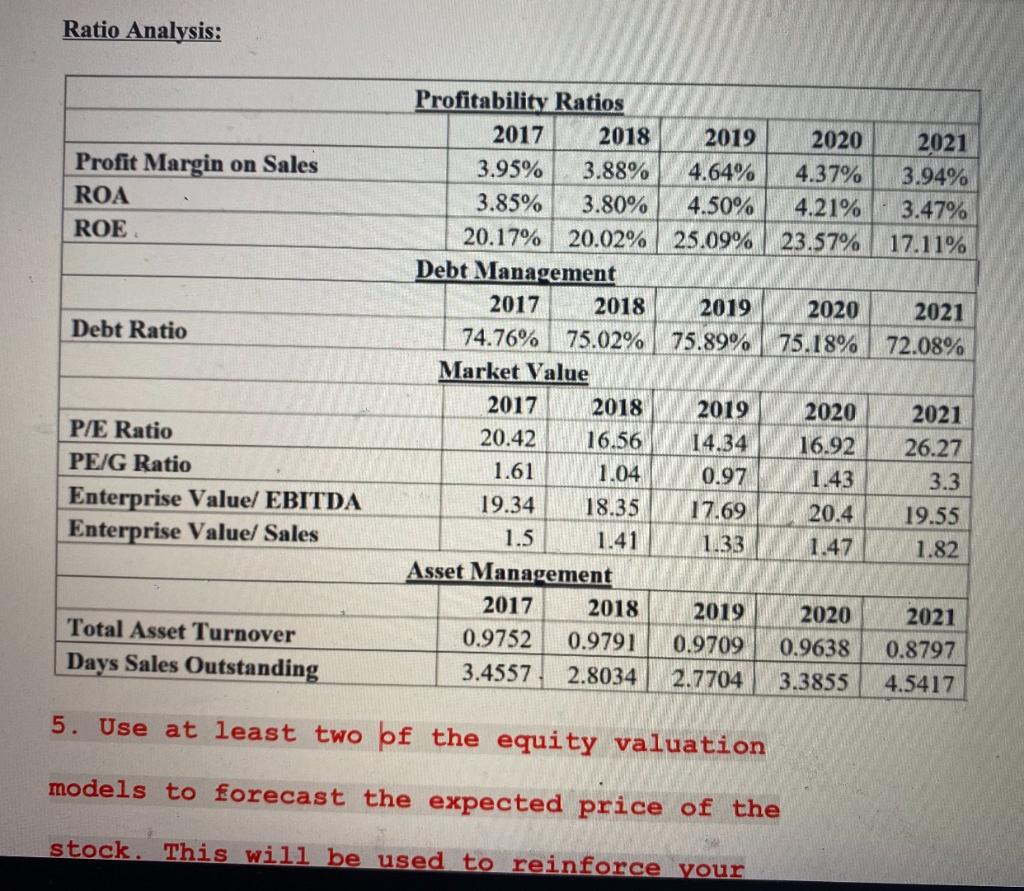
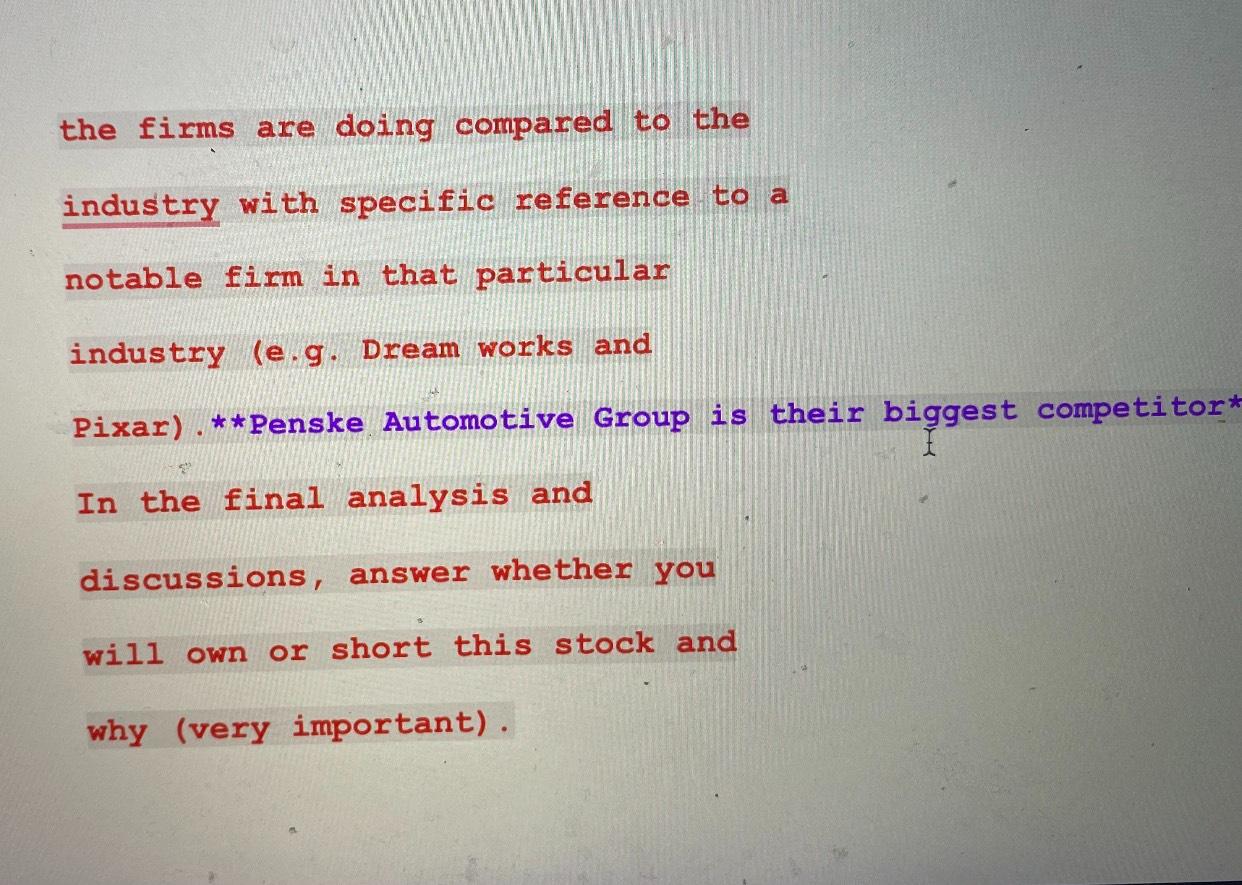
100% Normal text Courier New 13.5 + hala El 112 3 5 6 Enterprise Value/ Sales 1.33 1.47 1.82 4 1.5 1.41 Asset Management 2017 2018 0.9752 0.9791 3.4557 2.8034 Total Asset Turnover Days Sales Outstanding 2019 0.9709 2.7704 2020 0.9638 3.3855 2021 0.8797 4.5417 5. Use at least two of the equity valuation models to forecast the expected price of the stock. This will be used to reinforce your investment decision below. a. Discussion and Analysis : Discuss how Ratio Analysis: Profit Margin on Sales ROA ROE Debt Ratio Profitability Ratios 2017 2018 2019 2020 2021 3.95% 3.88% 4.64% 4.37% 3.94% 3.85% 3.80% 4.50% 4.21% 3.47% 20.17% 20.02% 25.09% 23.57% 17.11% Debt Management 2017 2018 2019 2020 2021 74.76% 75.02% 75.89% 75.18% 72.08% Market Value 2017 2018 2019 2020 2021 20.42 16.56 14.34 16.92 26.27 1.61 1.04 0.97 1.43 3.3 19.34 18.35 17.69 20.4 19.55 1.5 1.41 1.33 1.47 1.82 Asset Management 2017 2018 2019 2020 2021 0.9752 0.9791 0.9709 0.9638 0.8797 3.4557 2.8034 2.7704 3.3855 4.5417 P/E Ratio PEIG Ratio Enterprise Value/ EBITDA Enterprise Value/ Sales Total Asset Turnover Days Sales Outstanding 5. Use at least two bf the equity valuation models to forecast the expected price of the stock. This will be used to reinforce your the firms are doing compared to the industry with specific reference to a notable firm in that particular industry (e.g. Dream works and Pixar). **Penske Automotive Group is their biggest competitor* biggest In the final analysis and discussions, answer whether you will own or short this stock and why (very important). 100% Normal text Courier New 13.5 + hala El 112 3 5 6 Enterprise Value/ Sales 1.33 1.47 1.82 4 1.5 1.41 Asset Management 2017 2018 0.9752 0.9791 3.4557 2.8034 Total Asset Turnover Days Sales Outstanding 2019 0.9709 2.7704 2020 0.9638 3.3855 2021 0.8797 4.5417 5. Use at least two of the equity valuation models to forecast the expected price of the stock. This will be used to reinforce your investment decision below. a. Discussion and Analysis : Discuss how Ratio Analysis: Profit Margin on Sales ROA ROE Debt Ratio Profitability Ratios 2017 2018 2019 2020 2021 3.95% 3.88% 4.64% 4.37% 3.94% 3.85% 3.80% 4.50% 4.21% 3.47% 20.17% 20.02% 25.09% 23.57% 17.11% Debt Management 2017 2018 2019 2020 2021 74.76% 75.02% 75.89% 75.18% 72.08% Market Value 2017 2018 2019 2020 2021 20.42 16.56 14.34 16.92 26.27 1.61 1.04 0.97 1.43 3.3 19.34 18.35 17.69 20.4 19.55 1.5 1.41 1.33 1.47 1.82 Asset Management 2017 2018 2019 2020 2021 0.9752 0.9791 0.9709 0.9638 0.8797 3.4557 2.8034 2.7704 3.3855 4.5417 P/E Ratio PEIG Ratio Enterprise Value/ EBITDA Enterprise Value/ Sales Total Asset Turnover Days Sales Outstanding 5. Use at least two bf the equity valuation models to forecast the expected price of the stock. This will be used to reinforce your the firms are doing compared to the industry with specific reference to a notable firm in that particular industry (e.g. Dream works and Pixar). **Penske Automotive Group is their biggest competitor* biggest In the final analysis and discussions, answer whether you will own or short this stock and why (very important)Step by Step Solution
There are 3 Steps involved in it
Step: 1

Get Instant Access to Expert-Tailored Solutions
See step-by-step solutions with expert insights and AI powered tools for academic success
Step: 2

Step: 3
Ace Your Homework with AI
Get the answers you need in no time with our AI-driven, step-by-step assistance
Get Started