Answered step by step
Verified Expert Solution
Link Copied!

Question

1 Approved Answer

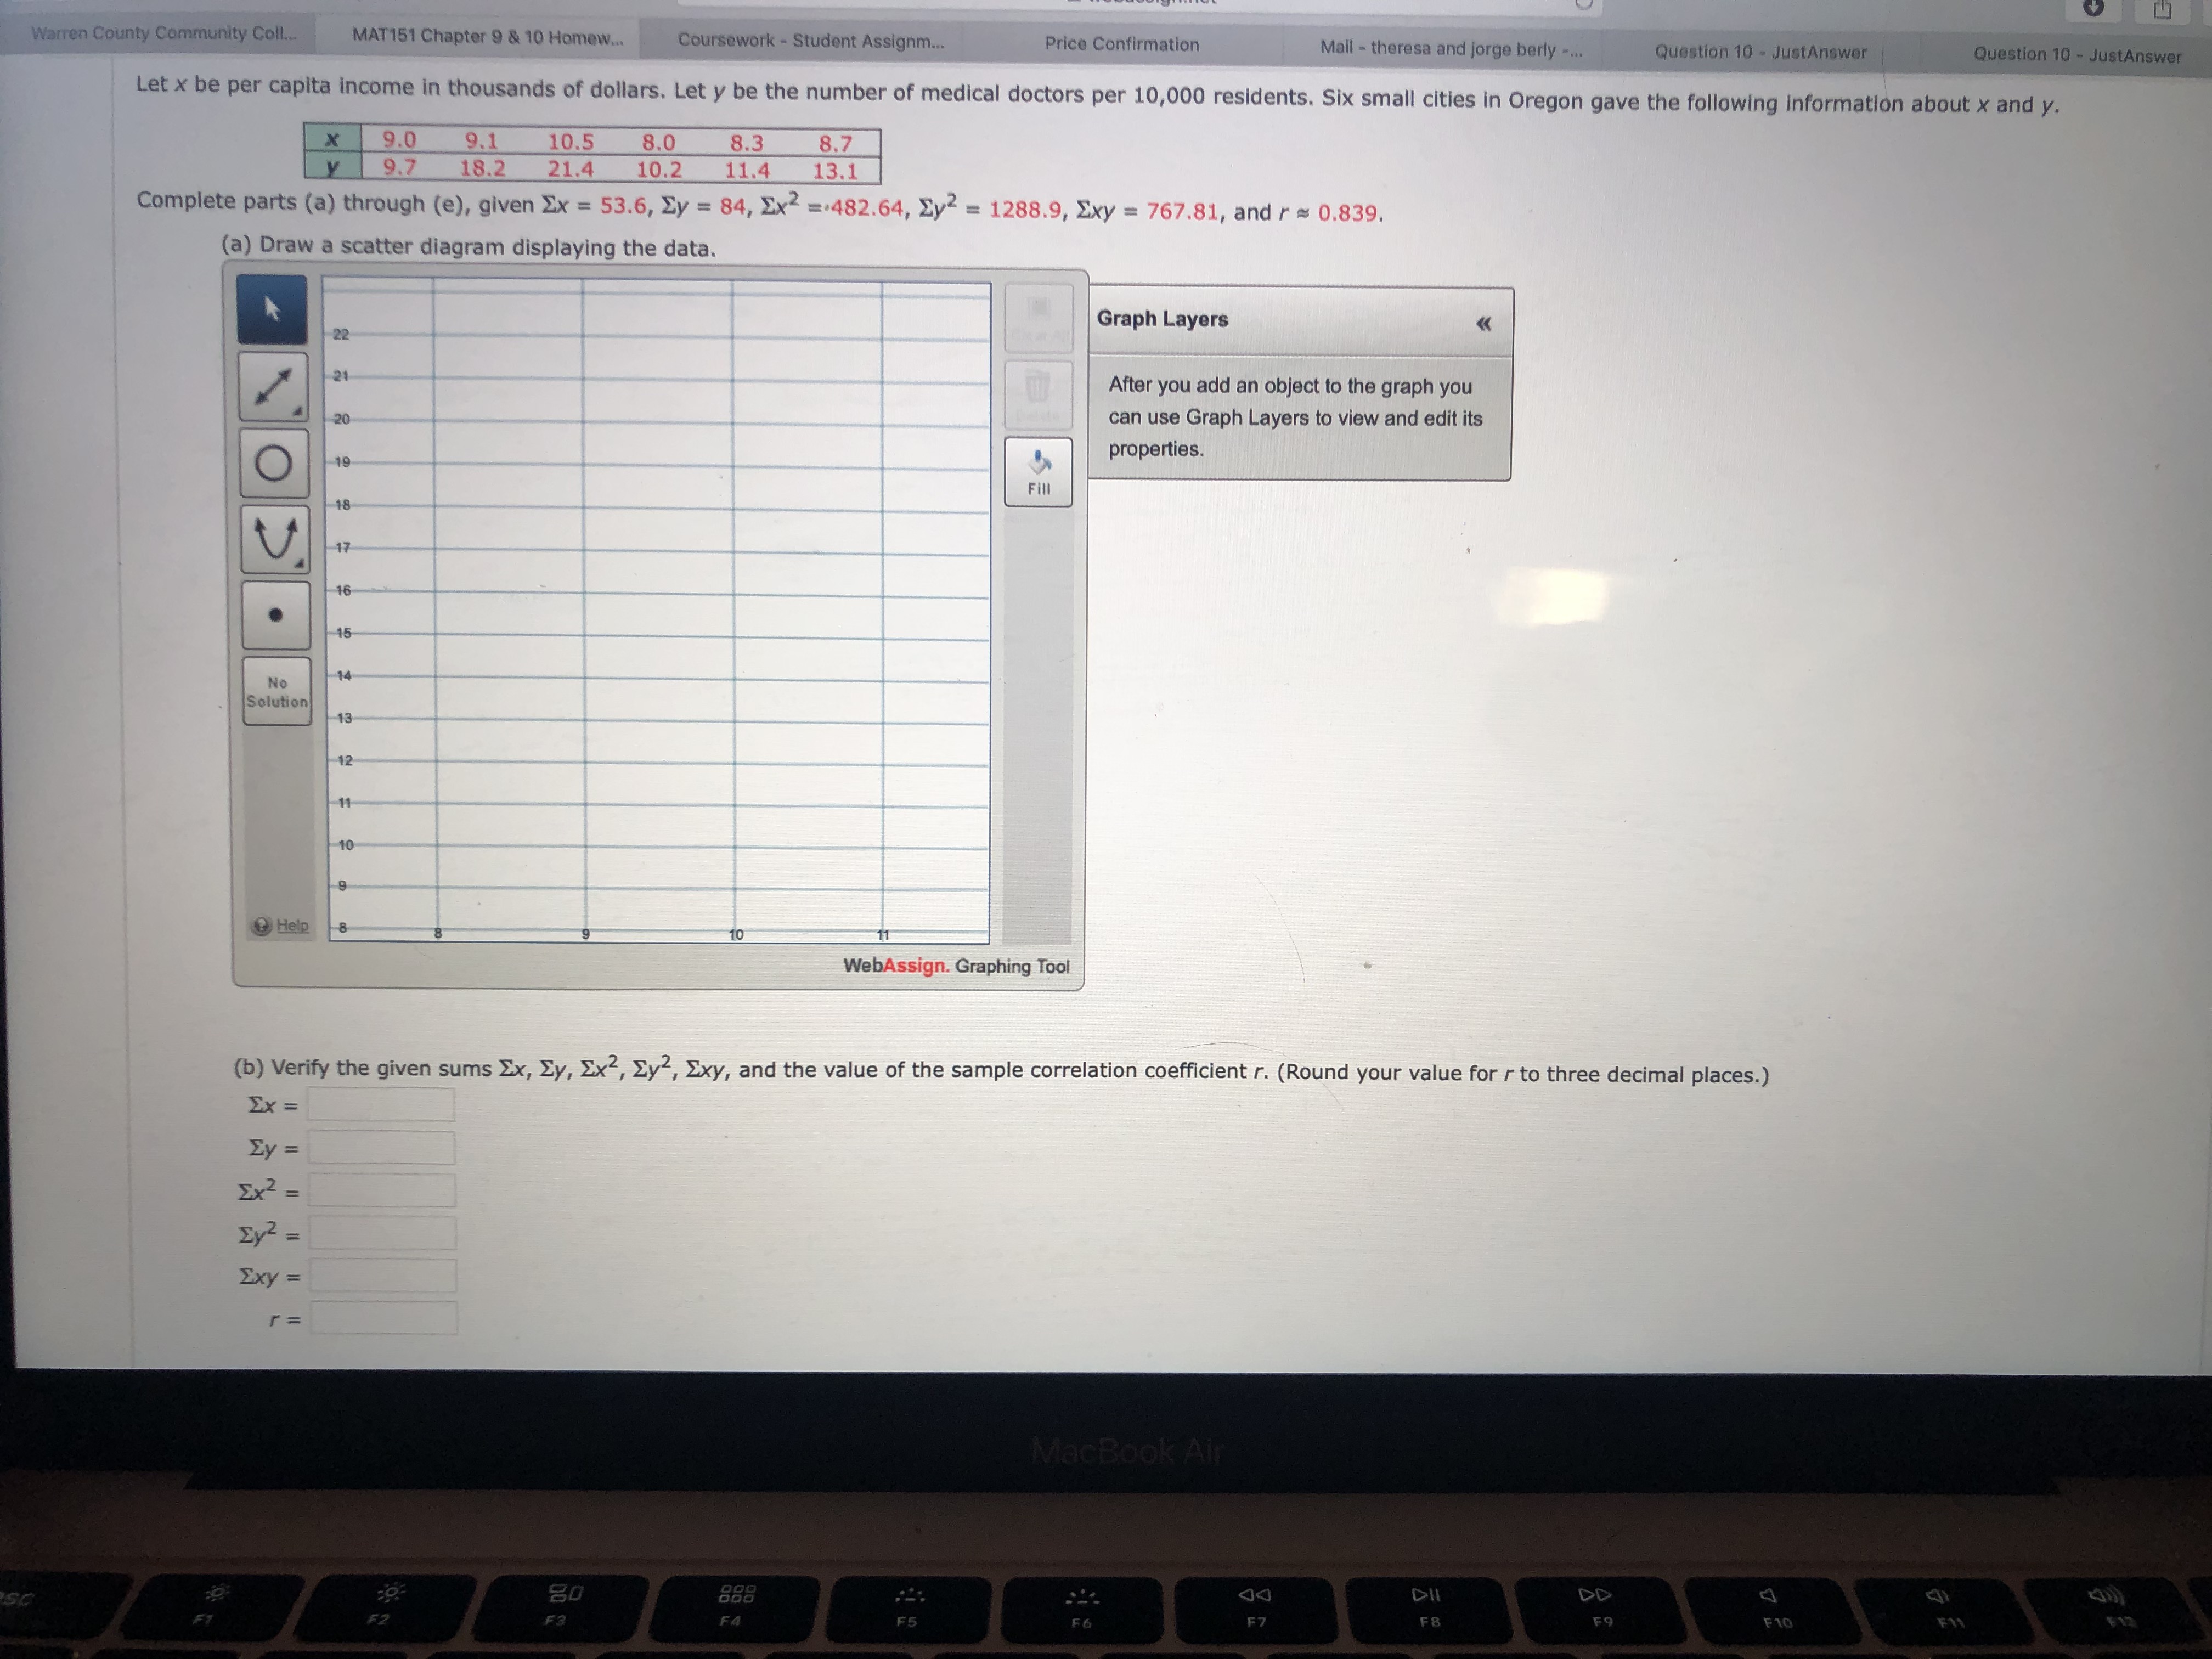
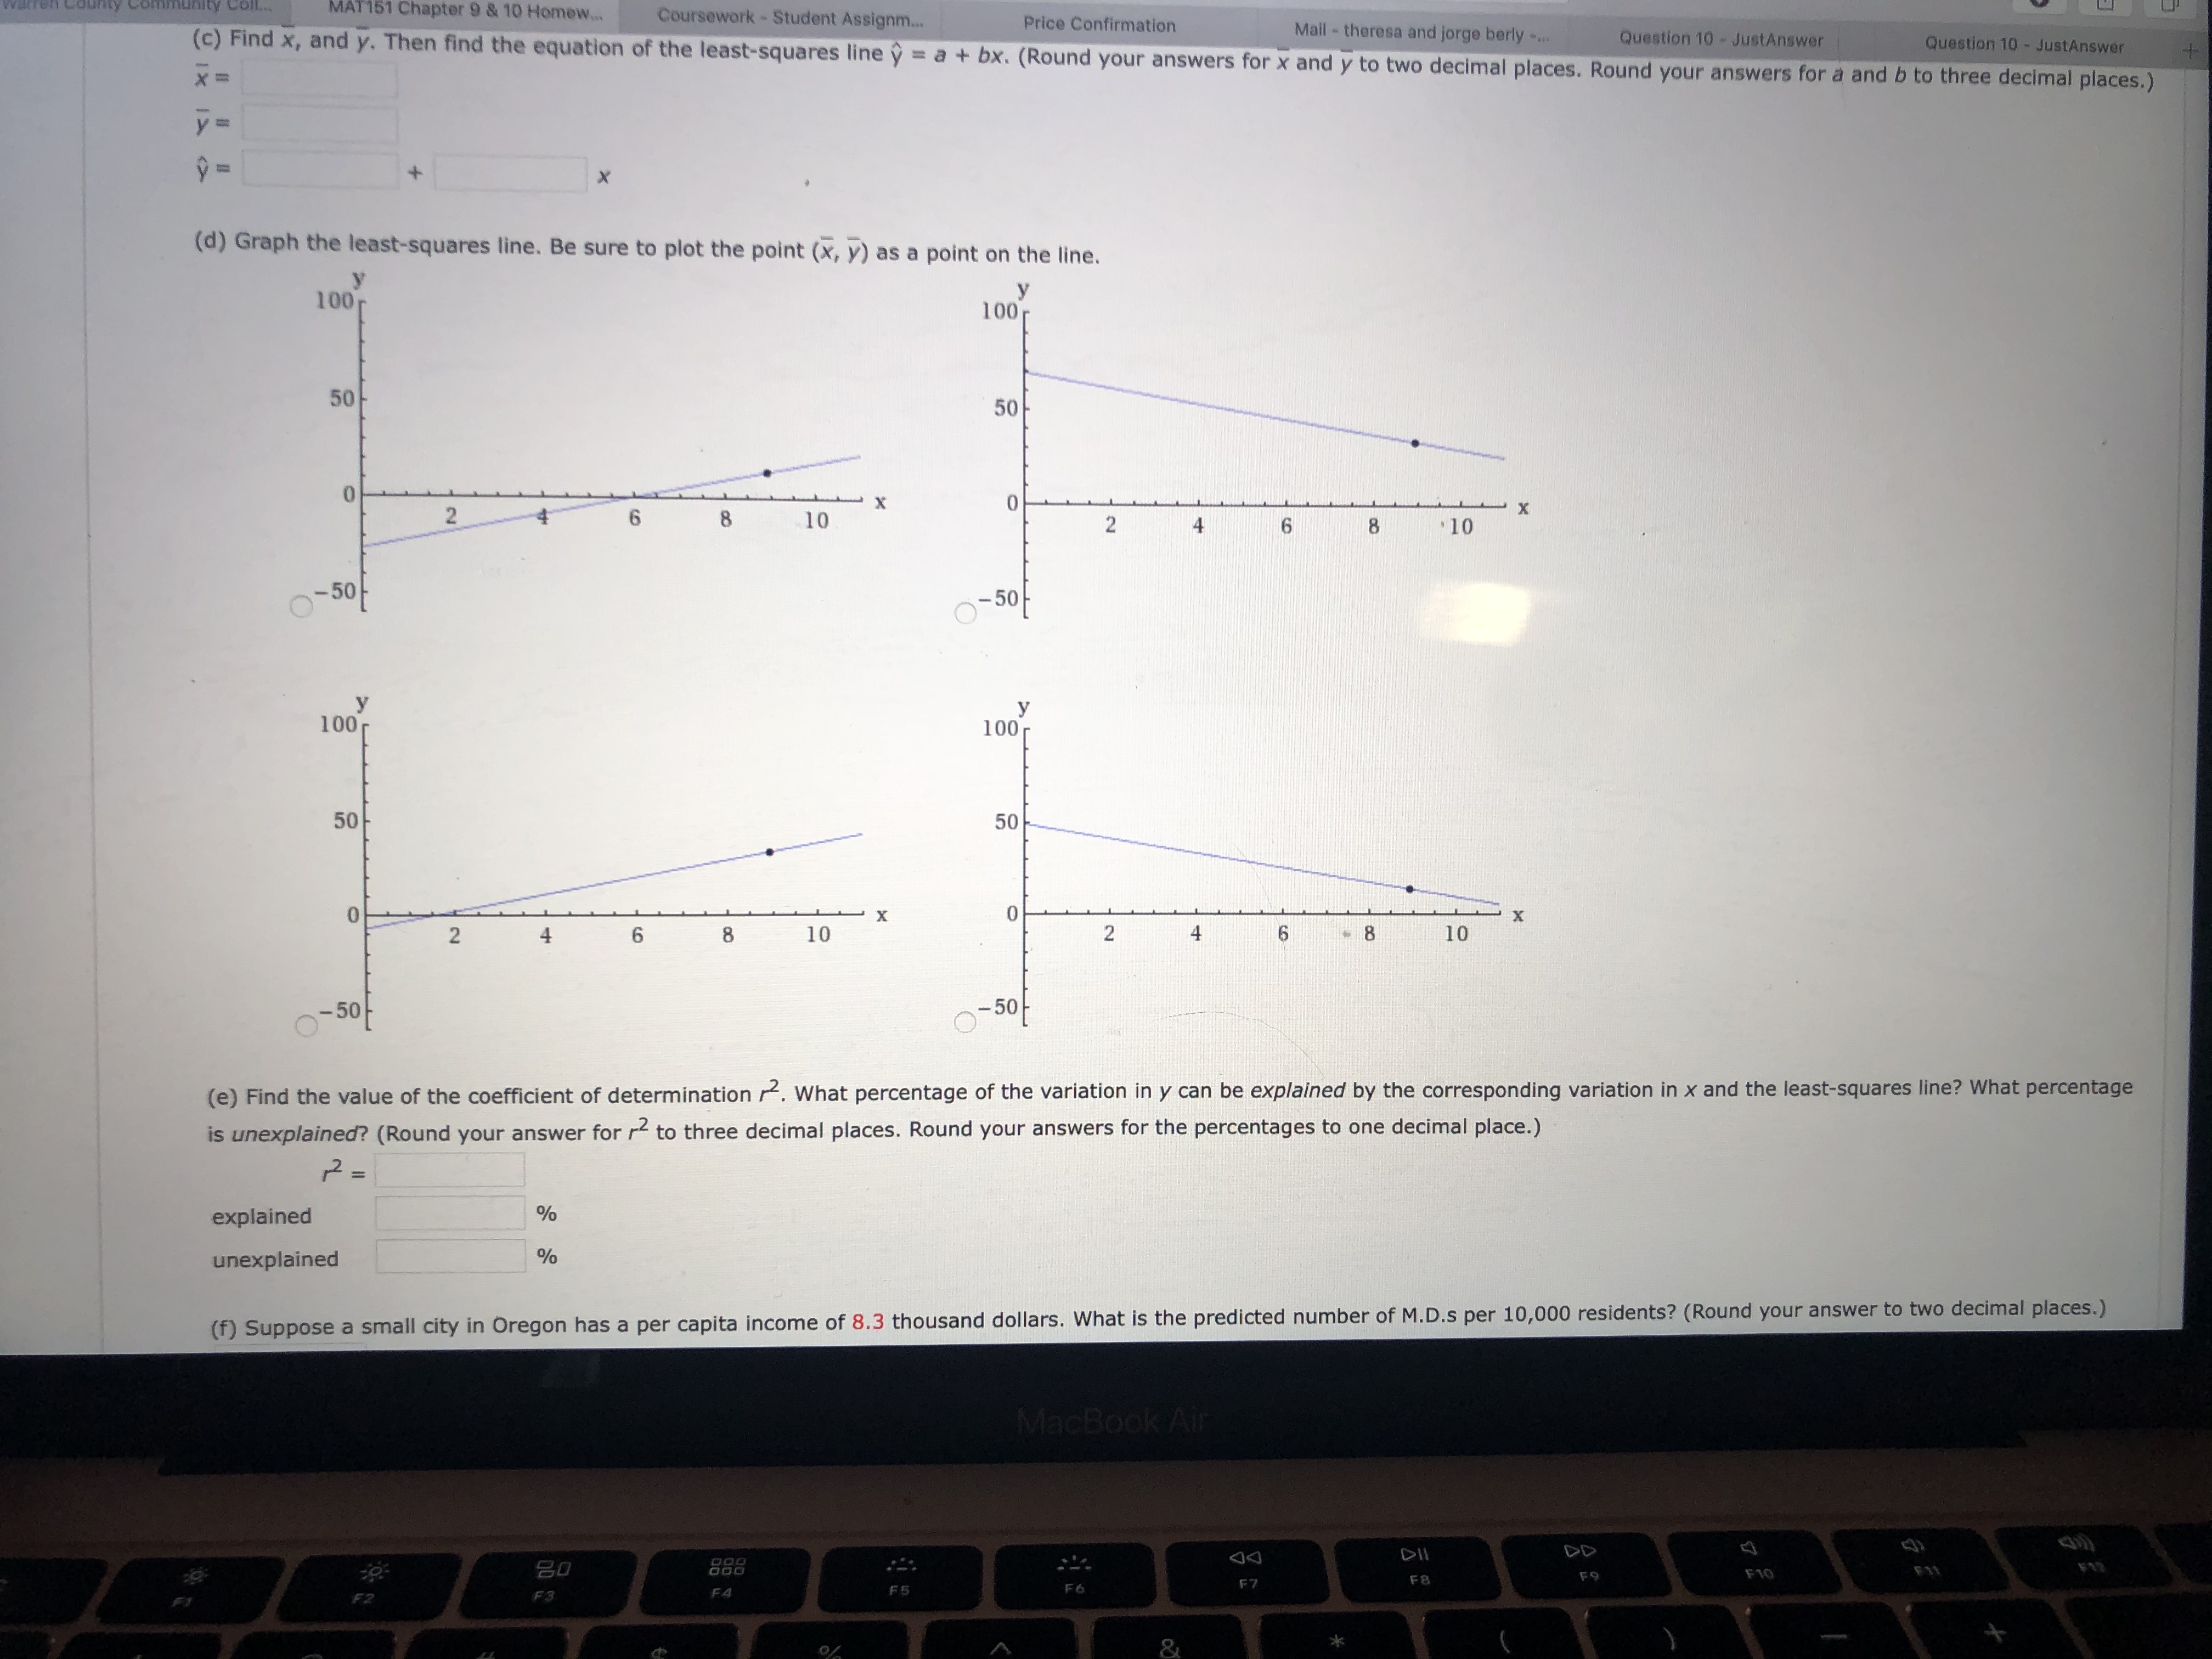
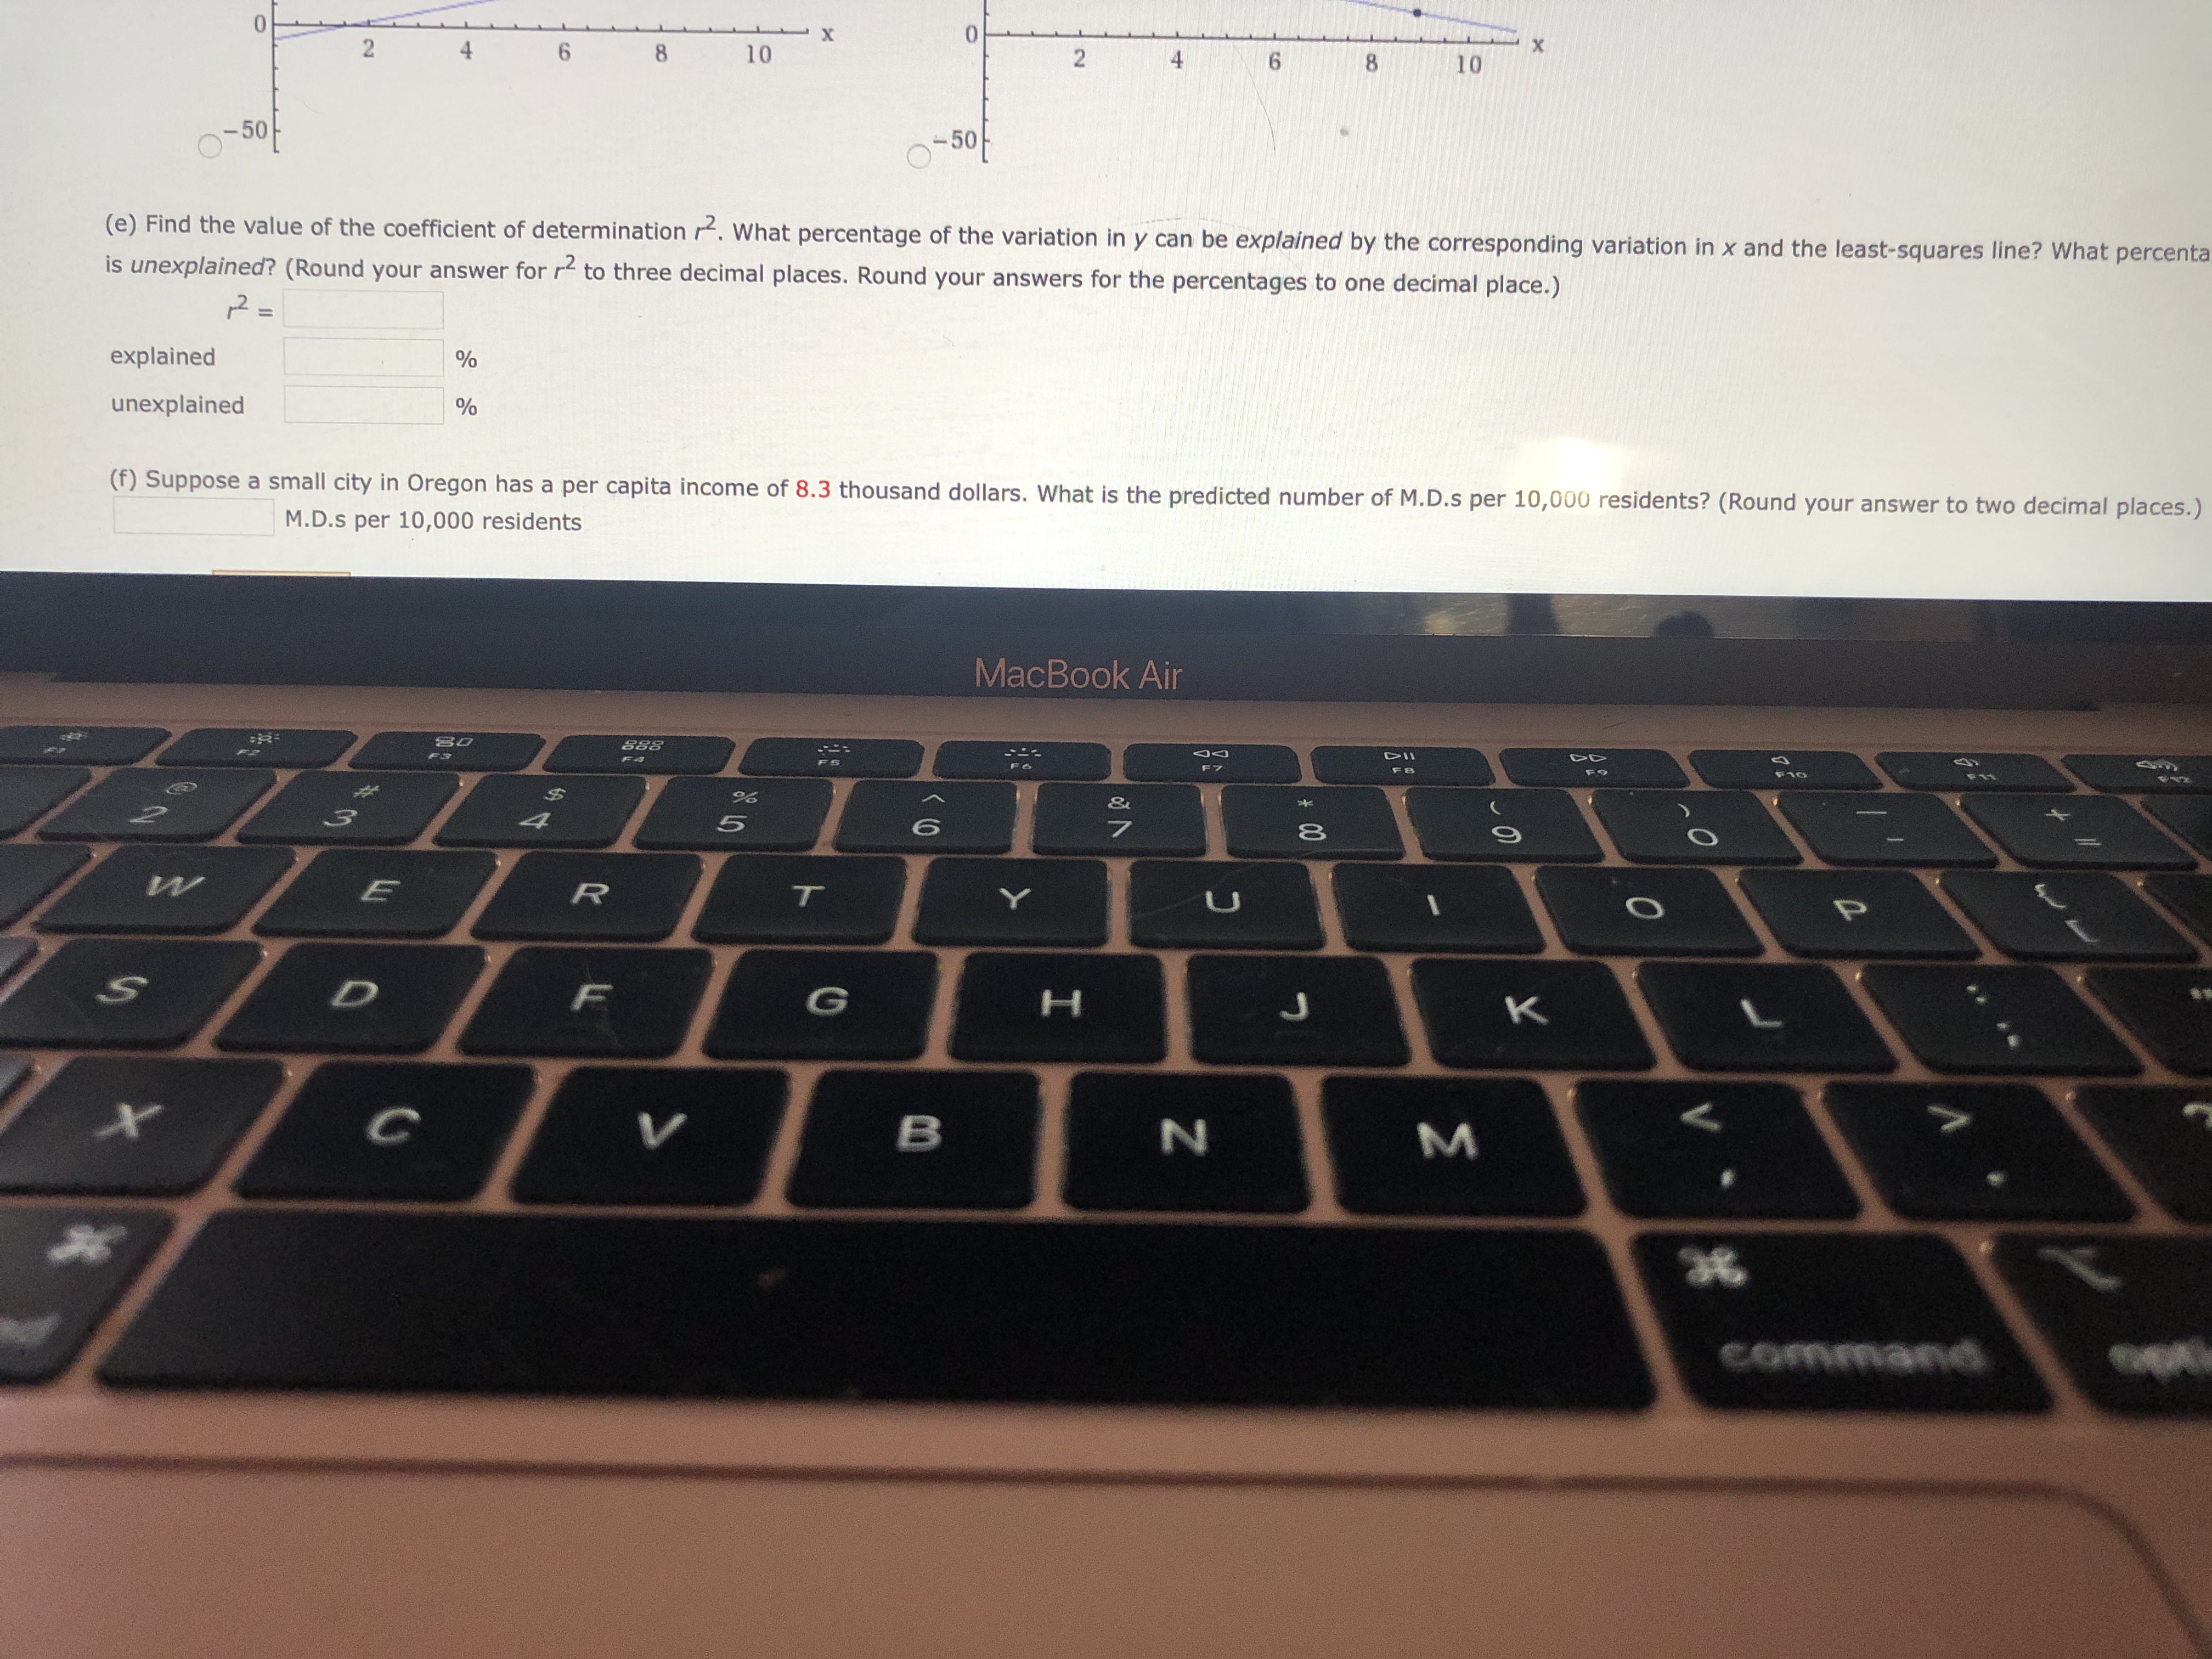
this is all one question Warren County Community Coll. MAT151 Chapter 9 & 10 Homew. Coursework - Student Assignm... Price Confirmation Mail - theresa and

this is all one question

image text in transcribedimage text in transcribedimage text in transcribed
Warren County Community Coll. MAT151 Chapter 9 & 10 Homew. Coursework - Student Assignm... Price Confirmation Mail - theresa and jorge berly -... Question 10 - JustAnswer Question 10 - JustAnswer Let x be per capita income in thousands of dollars. Let y be the number of medical doctors per 10,000 residents. Six small cities in Oregon gave the following information about x and y. x 9.0 9.7 9.1 18.2 10.5 8.0 21.4 10.2 8.3 11.4 8.7 13.1 Complete parts (a) through (e), given Ex = 53.6, Zy = 84, Ex2 =.482.64, Zy? = 1288.9, Exy = 767.81, and r = 0.839. (a) Draw a scatter diagram displaying the data. Graph Layers After you add an object to the graph you can use Graph Layers to view and edit its properties. Fill . Solution Help WebAssign. Graphing Tool (b) Verify the given sums Ex, Ey, Ex2, Zy2, Exy, and the value of the sample correlation coefficient r. (Round your value for r to three decimal places.) Ex = Ey = Ex? = Ey? = Exy = r = MacBook Air 80 DD F3 F4 F5 F6 F7 FB F9 F101 151 Chapter 9 & 10 Homew.. Coursework - Student Assignm. Price Confirmation Mail - theresa and jorge berly -. Question 10 - JustAnswer (c) Find x, and y. Then find the equation of the least-squares line y = a + bx. (Round your answers for x and y to two decimal places. Round your answers for a and b to three decimal places.) Question 10 - JustAnswer X = y = 1 = (d) Graph the least-squares line. Be sure to plot the point (x, y) as a point on the line. 100 100 50 50 6 8 * X 0 2 10 2 6 8 $ 10 -50 100 100 501 50 0 2 8 10 2 6 - 8 10 -50 (e) Find the value of the coefficient of determination . What percentage of the variation in y can be explained by the corresponding variation in x and the least-squares line? What percentage is unexplained? (Round your answer for r2 to three decimal places. Round your answers for the percentages to one decimal place.) 12 = explained % unexplained (f) Suppose a small city in Oregon has a per capita income of 8.3 thousand dollars. What is the predicted number of M.D.s per 10,000 residents? (Round your answer to two decimal places.) MacBook Air 20 868 DD FO F10 F3 EA F6 F7(e) Find the value of the coefcient of determination r2. What percentage of the variation In y can be explained by the corresponding variation In x and the least- ls unexplained? (Round your answer for r2 to three decimal places. Round your answers for the percentages to one decimal place.) ,1: explained % squares line? What percent}: unexplained \"/0 M.D.s per 10,000 residents

Step by Step Solution

There are 3 Steps involved in it

Step: 1

blur-text-image

Get Instant Access to Expert-Tailored Solutions

See step-by-step solutions with expert insights and AI powered tools for academic success

Step: 2

blur-text-image

Step: 3

blur-text-image

Ace Your Homework with AI

Get the answers you need in no time with our AI-driven, step-by-step assistance

Get Started

Recommended Textbook for

An Introduction to Measure Theoretic Probability

Authors: George G. Roussas

2nd edition

128000422, 978-0128000427

More Books

Students also viewed these Mathematics questions

Question

Describe and debunk three common myths about leadership.

Answered: 1 week ago