Answered step by step
Verified Expert Solution
Question
1 Approved Answer
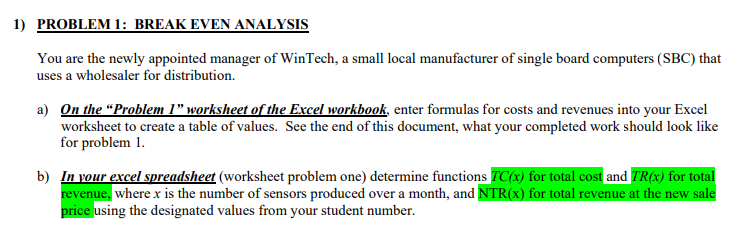
This is all part of the first question. The numbers needed for this are A=1, B=6, C=5, D=7 1) PROBLEM 1: BREAK EVEN ANALYSIS You


This is all part of the first question. The numbers needed for this are A=1, B=6, C=5, D=7
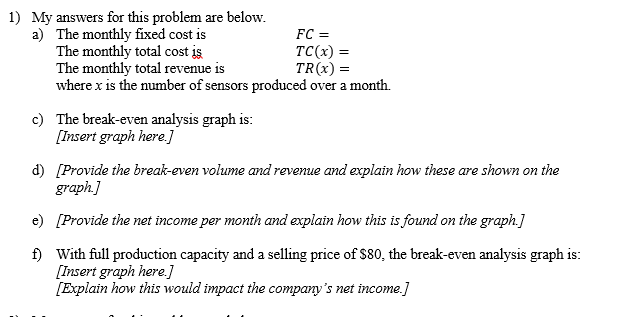
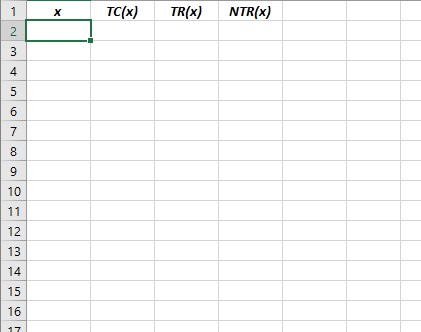
1) PROBLEM 1: BREAK EVEN ANALYSIS You are the newly appointed manager of WinTech, a small local manufacturer of single board computers (SBC) that uses a wholesaler for distribution. a) On the "Problem 1 worksheet of the Excel workbook, enter formulas for costs and revenues into your Excel worksheet to create a table of values. See the end of this document, what your completed work should look like for problem 1. b) In your excel spreadsheet (worksheet problem one) determine functions TC(x) for total cost and TR(x) for total revenue, where x is the number of sensors produced over a month, and NTR(x) for total revenue at the new sale price using the designated values from your student number. 1) My answers for this problem are below. a) The monthly fixed cost is FC = The monthly total cost is TC(x) = The monthly total revenue is TR(x) = where x is the number of sensors produced over a month. c) The break-even analysis graph is: [Insert graph here.) d) (Provide the break-even volume and revenue and explain how these are shown on the graph] e) [Provide the net income per month and explain how this is found on the graph.] f) With full production capacity and a selling price of $80, the break-even analysis graph is: [Insert graph here. [Explain how this would impact the company's net income.] 1 TC(x) TR(x) NTR(x) 0 m 4 5 6 7 8 9 9 10 11 12 13 14 15 16 17 1) PROBLEM 1: BREAK EVEN ANALYSIS You are the newly appointed manager of WinTech, a small local manufacturer of single board computers (SBC) that uses a wholesaler for distribution. a) On the "Problem 1 worksheet of the Excel workbook, enter formulas for costs and revenues into your Excel worksheet to create a table of values. See the end of this document, what your completed work should look like for problem 1. b) In your excel spreadsheet (worksheet problem one) determine functions TC(x) for total cost and TR(x) for total revenue, where x is the number of sensors produced over a month, and NTR(x) for total revenue at the new sale price using the designated values from your student number. 1) My answers for this problem are below. a) The monthly fixed cost is FC = The monthly total cost is TC(x) = The monthly total revenue is TR(x) = where x is the number of sensors produced over a month. c) The break-even analysis graph is: [Insert graph here.) d) (Provide the break-even volume and revenue and explain how these are shown on the graph] e) [Provide the net income per month and explain how this is found on the graph.] f) With full production capacity and a selling price of $80, the break-even analysis graph is: [Insert graph here. [Explain how this would impact the company's net income.] 1 TC(x) TR(x) NTR(x) 0 m 4 5 6 7 8 9 9 10 11 12 13 14 15 16 17Step by Step Solution
There are 3 Steps involved in it
Step: 1

Get Instant Access to Expert-Tailored Solutions
See step-by-step solutions with expert insights and AI powered tools for academic success
Step: 2

Step: 3

Ace Your Homework with AI
Get the answers you need in no time with our AI-driven, step-by-step assistance
Get Started


