

Answered step by step
Verified Expert Solution
Question
1 Approved Answer
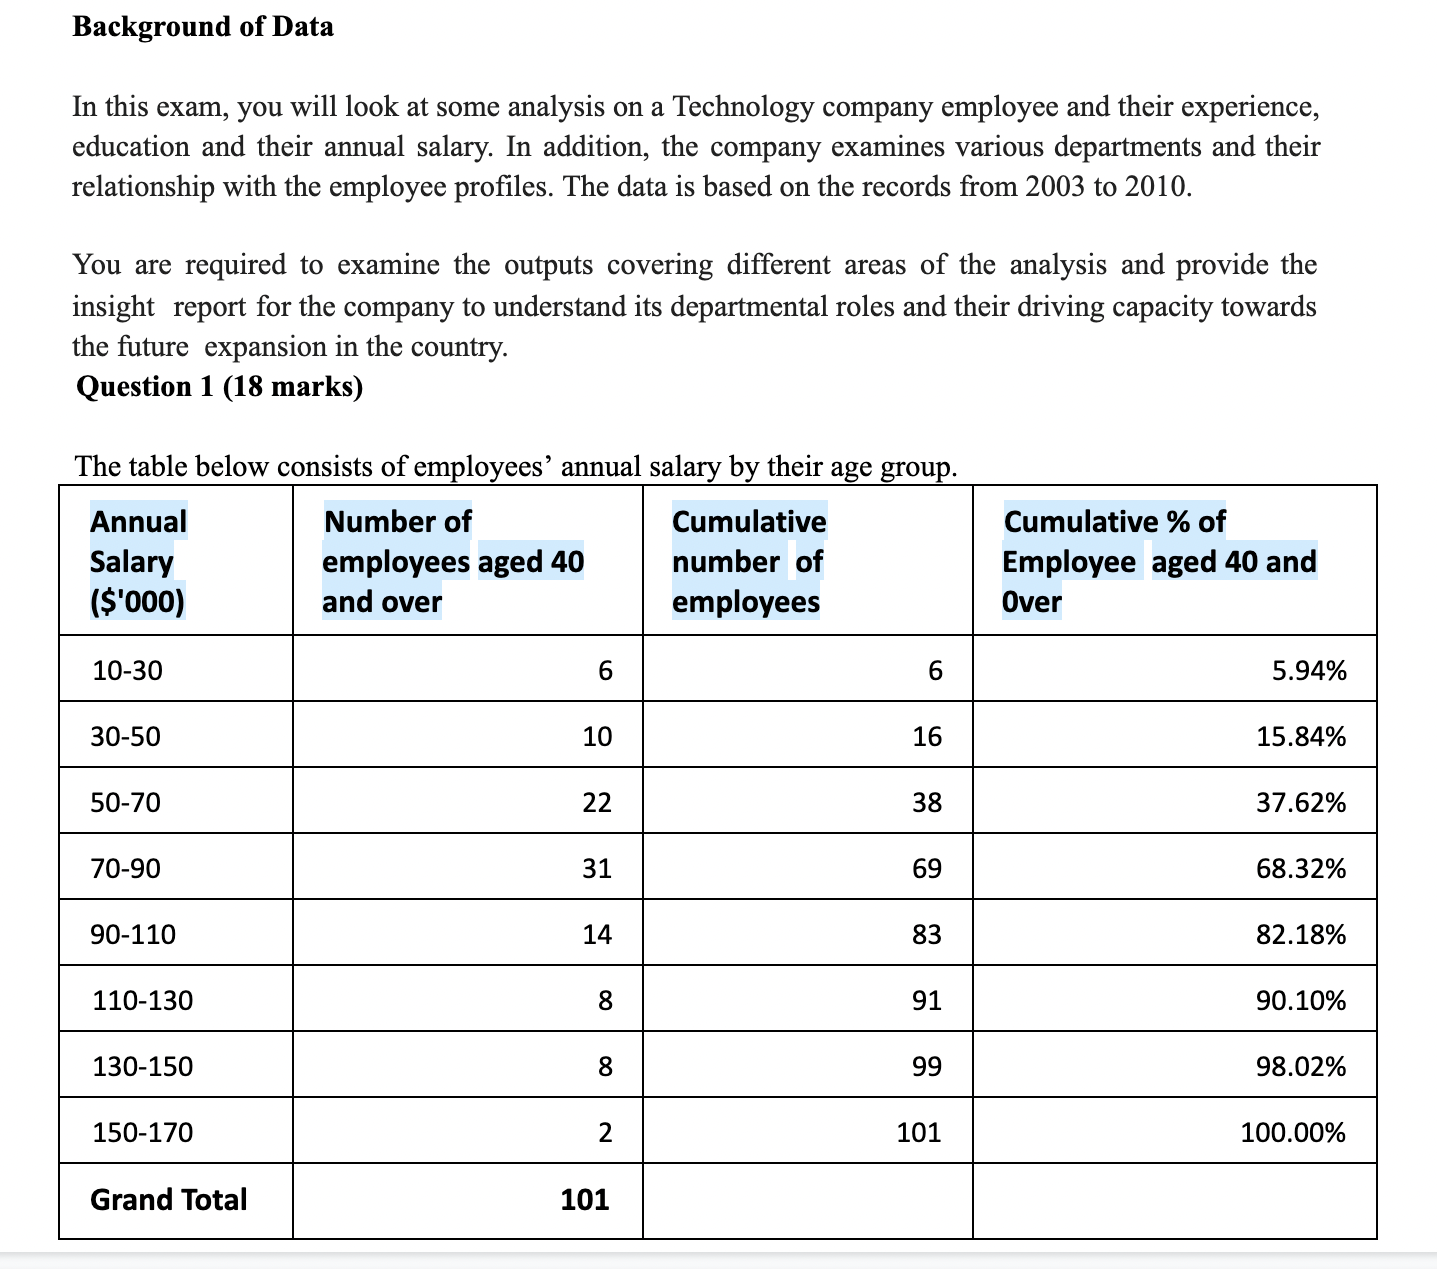
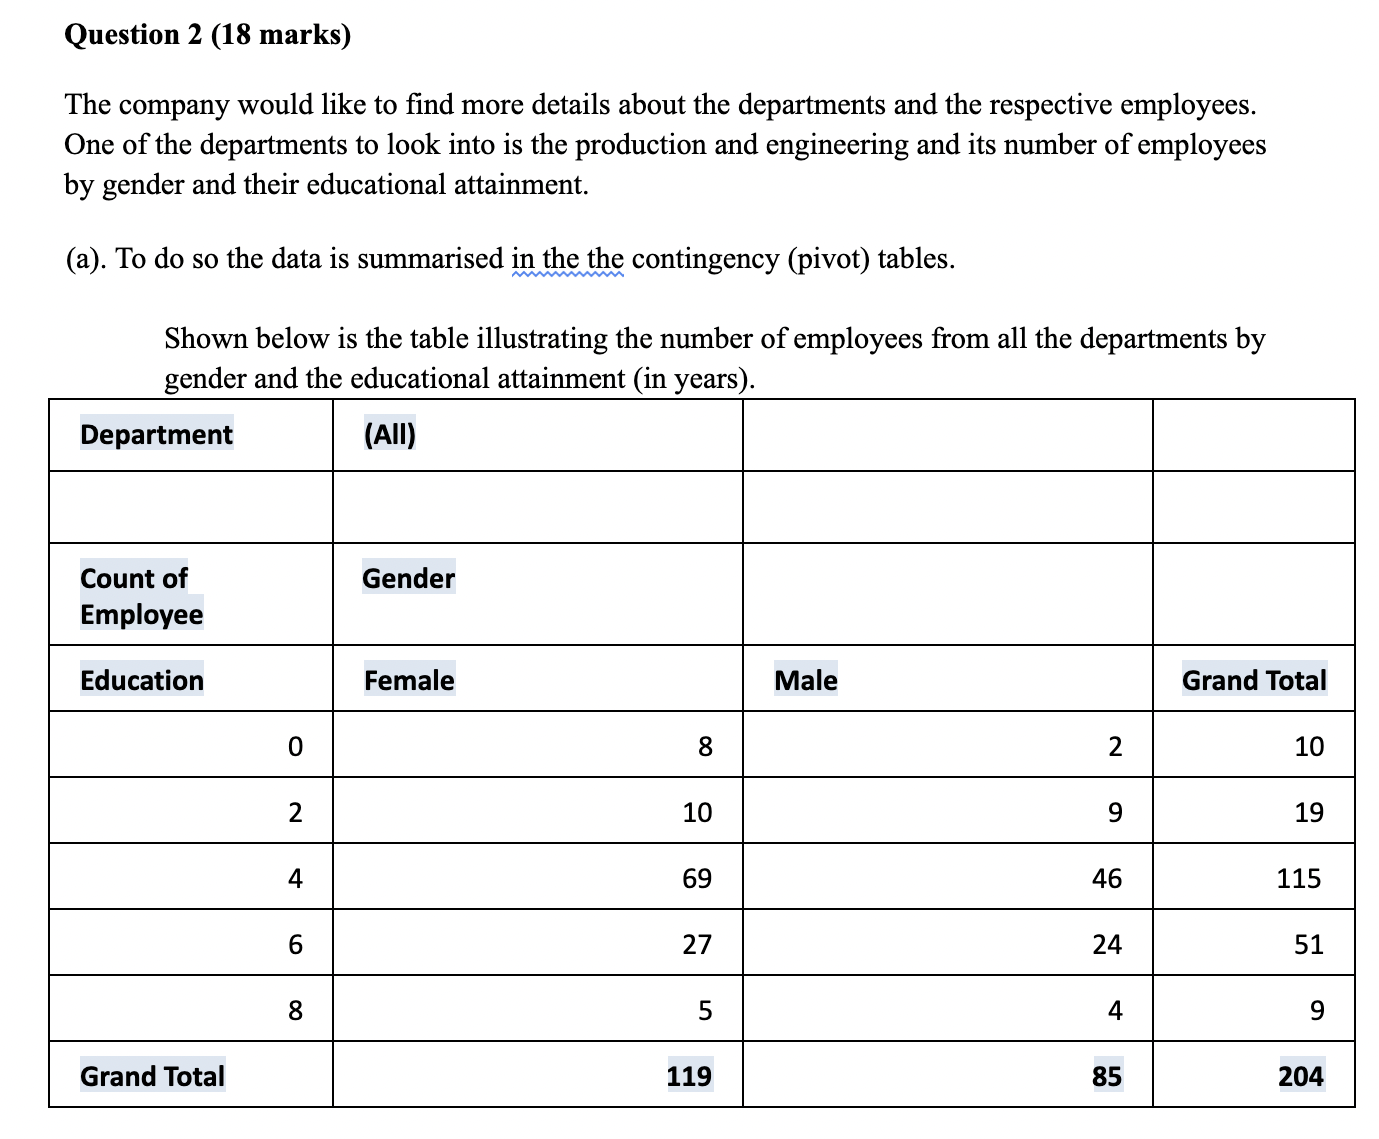
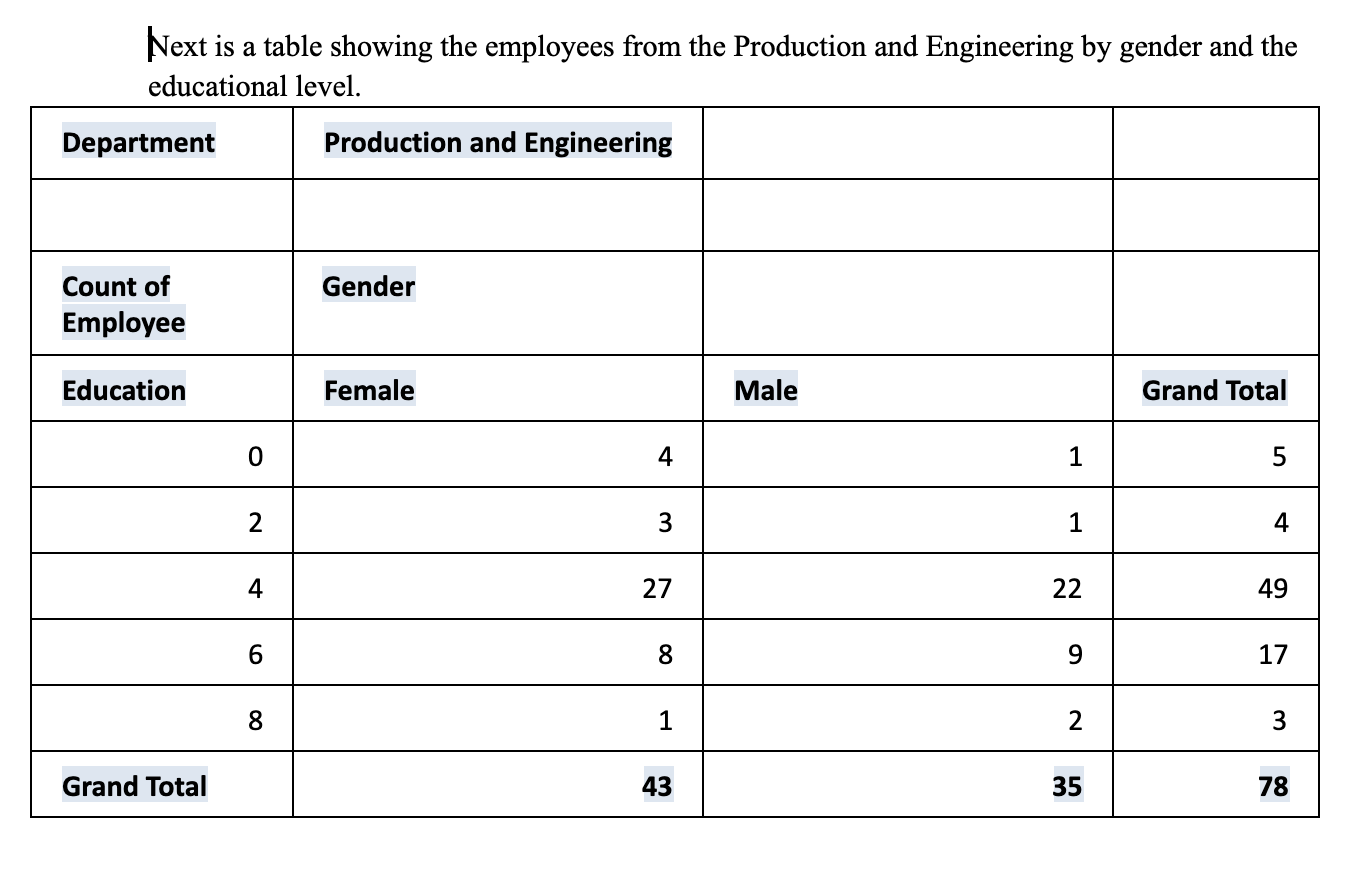
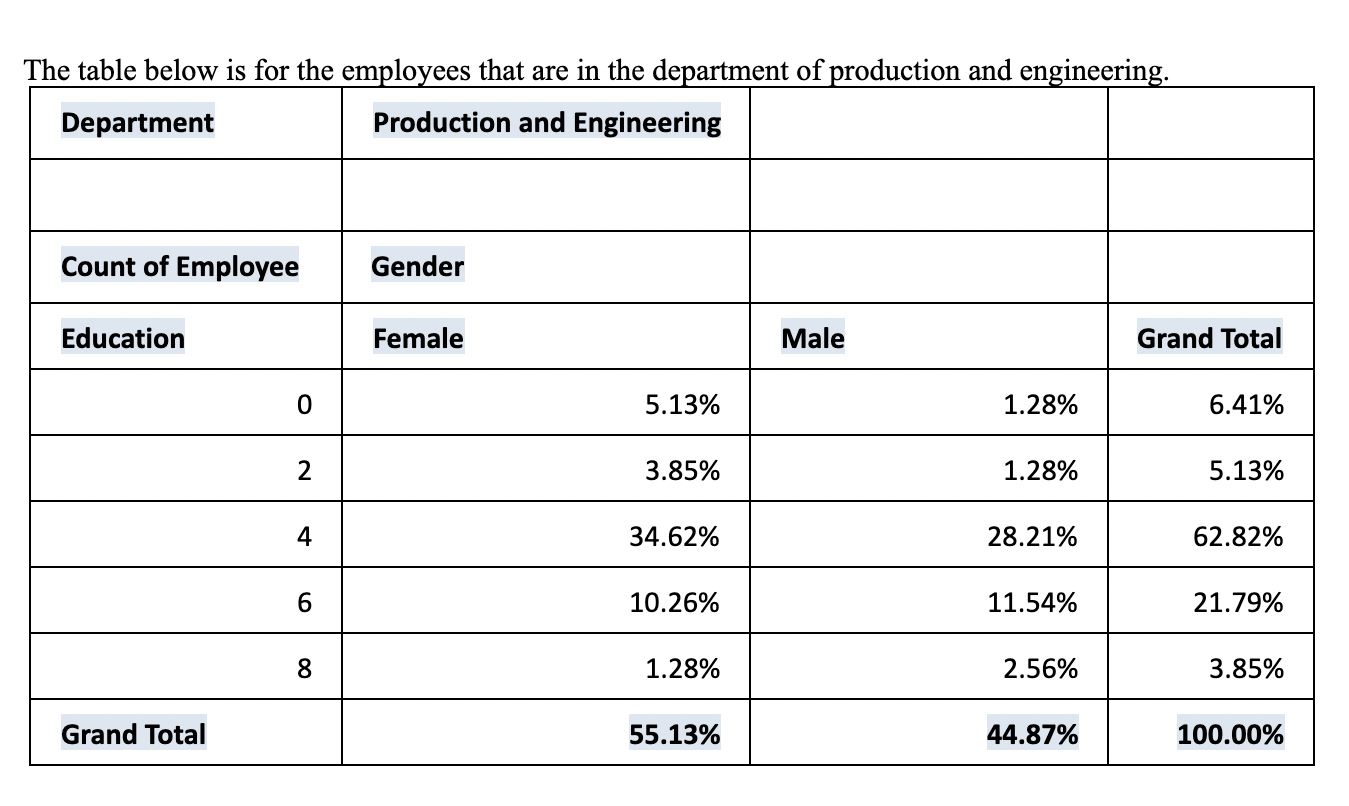
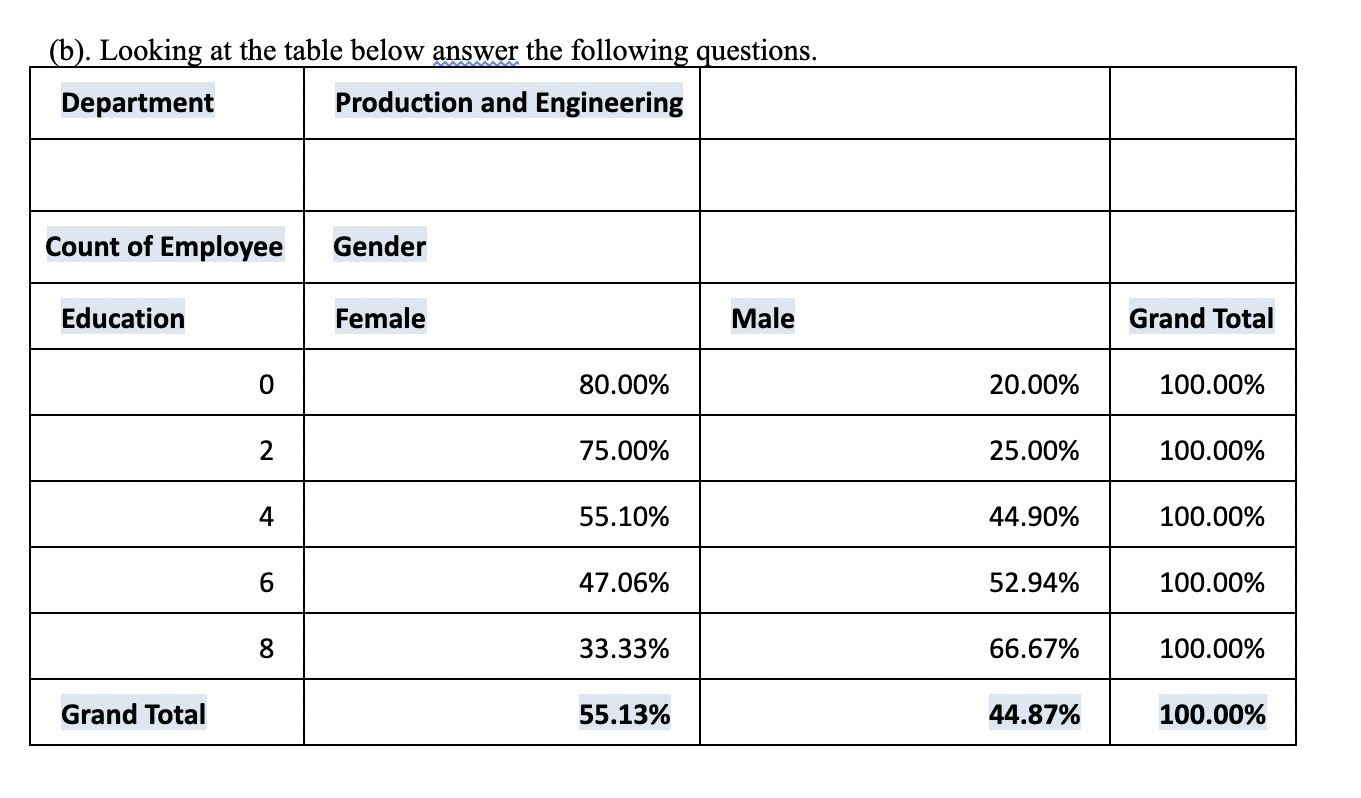
This is all the information I received for these questions. I just need help with (d) and Question 2 Background of Data In this exam,
This is all the information I received for these questions. I just need help with (d) and Question 2
Step by Step Solution
There are 3 Steps involved in it
Step: 1

Get Instant Access to Expert-Tailored Solutions
See step-by-step solutions with expert insights and AI powered tools for academic success
Step: 2

Step: 3
Ace Your Homework with AI
Get the answers you need in no time with our AI-driven, step-by-step assistance
Get Started
Advanced Engineering Mathematics
Authors: ERWIN KREYSZIG
9th Edition
0471488852, 978-0471488859