this is all the information please help me I'm having a hard time , thank you
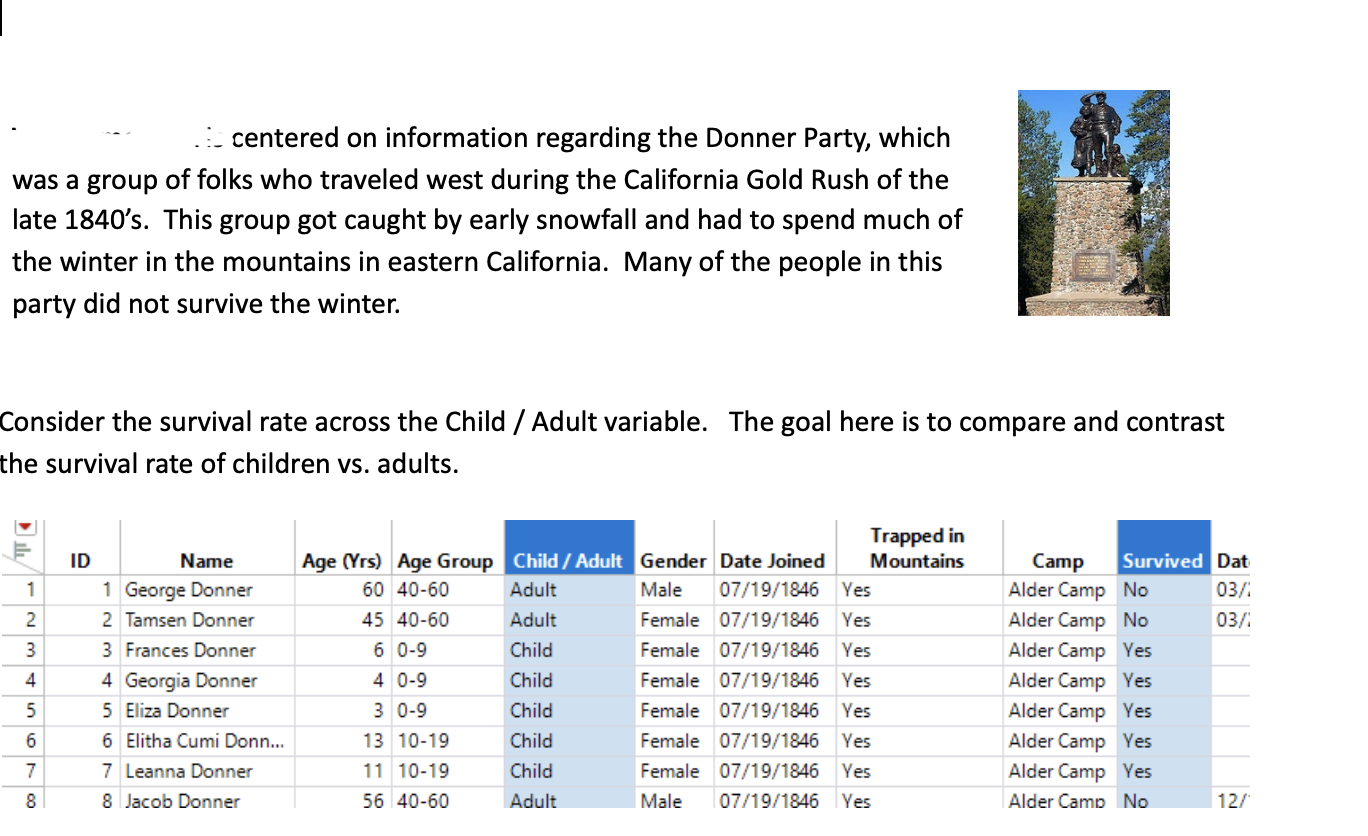
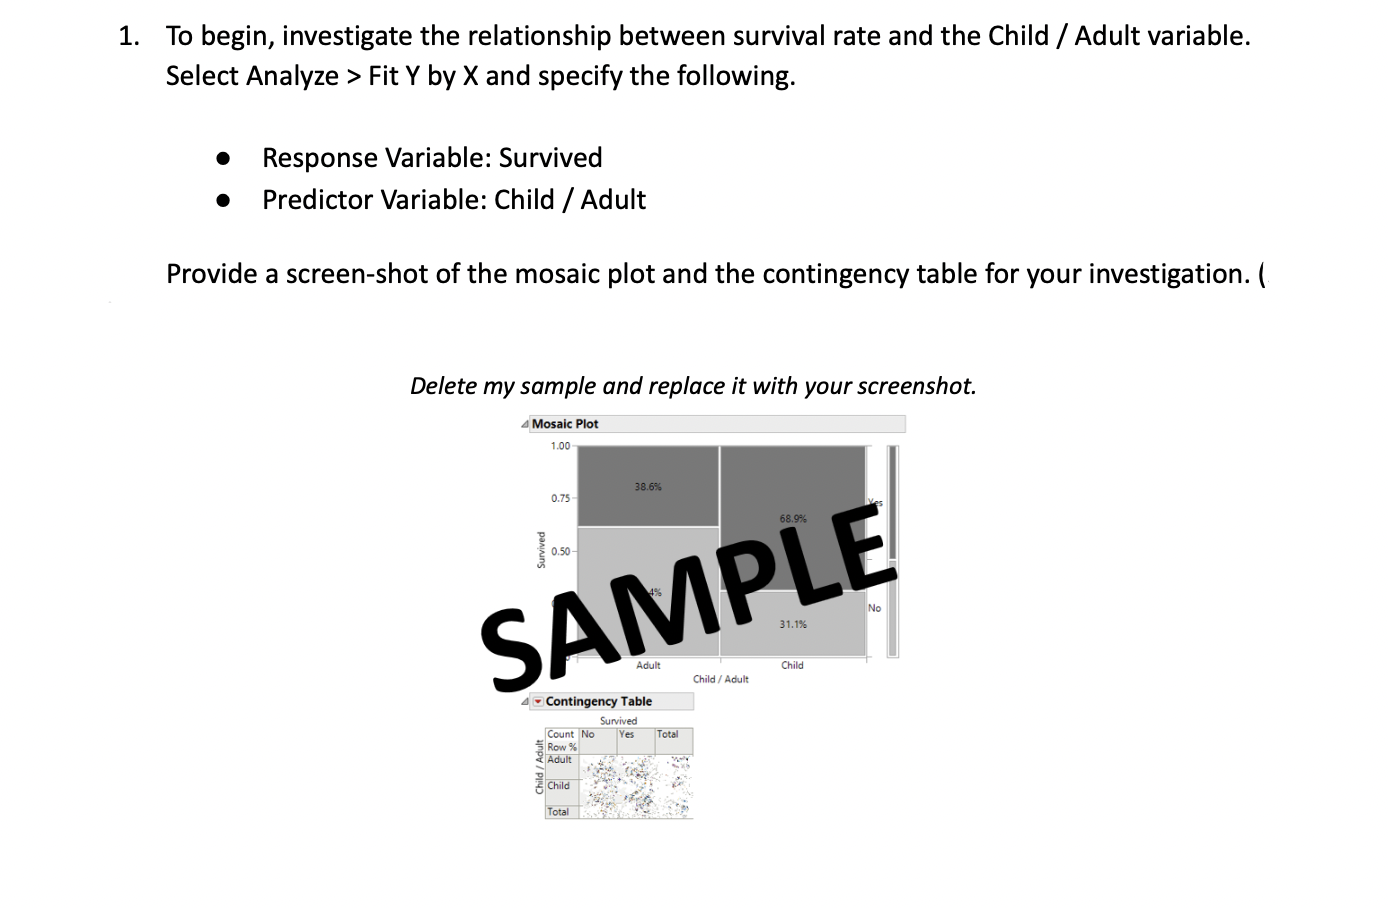
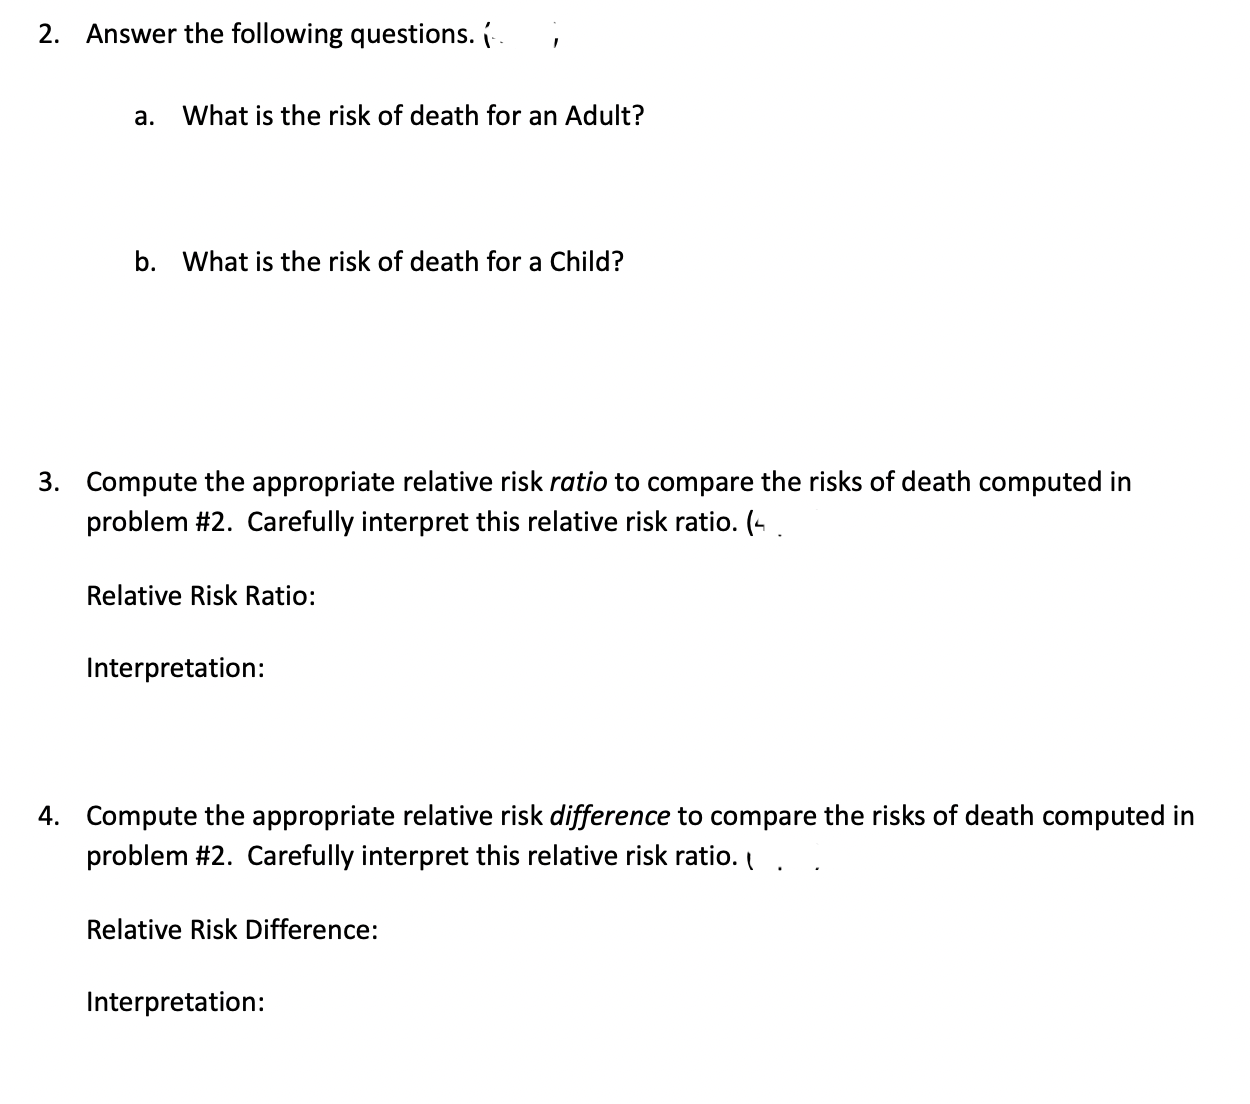
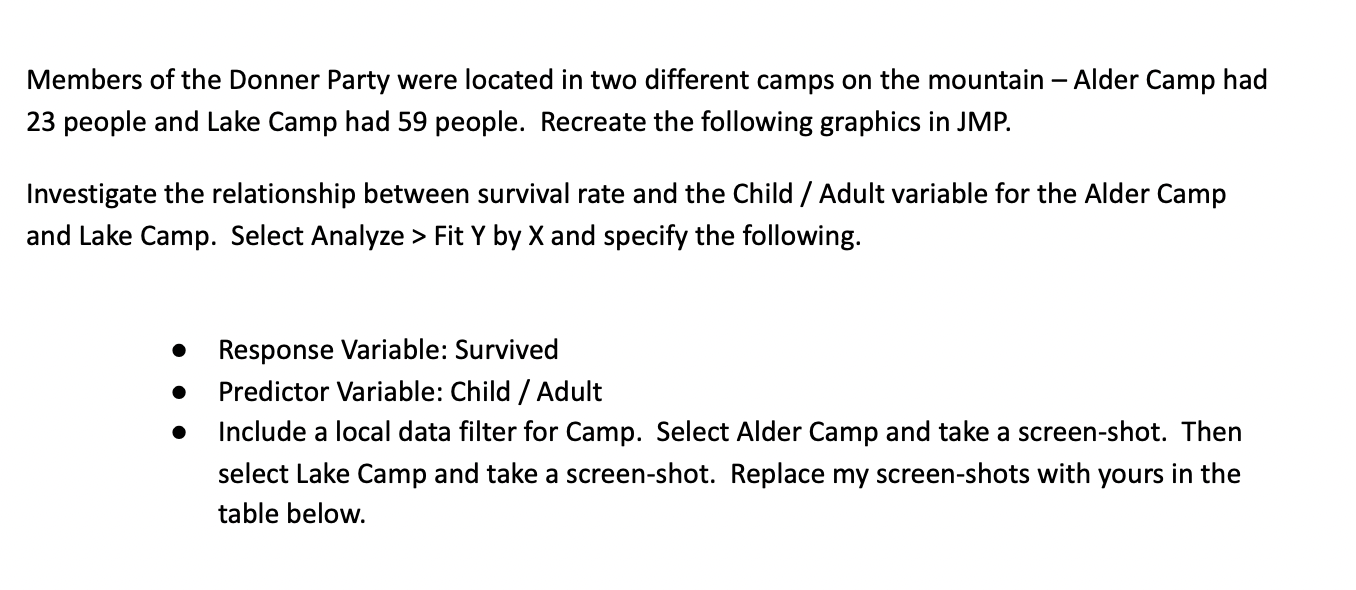
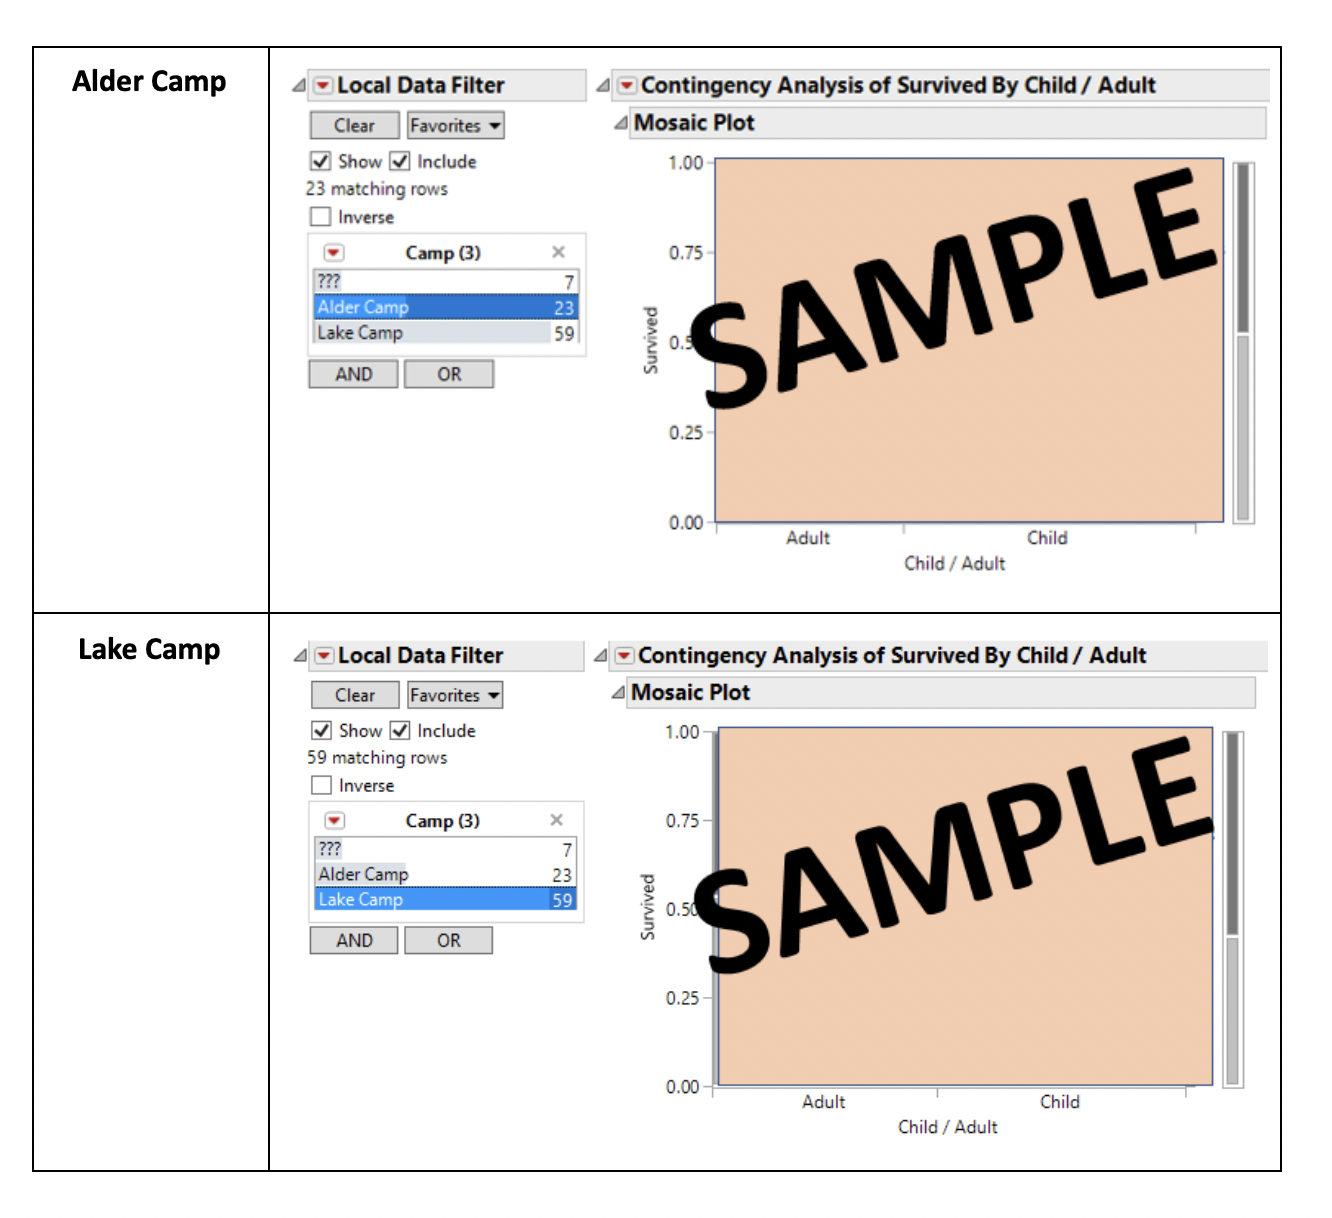
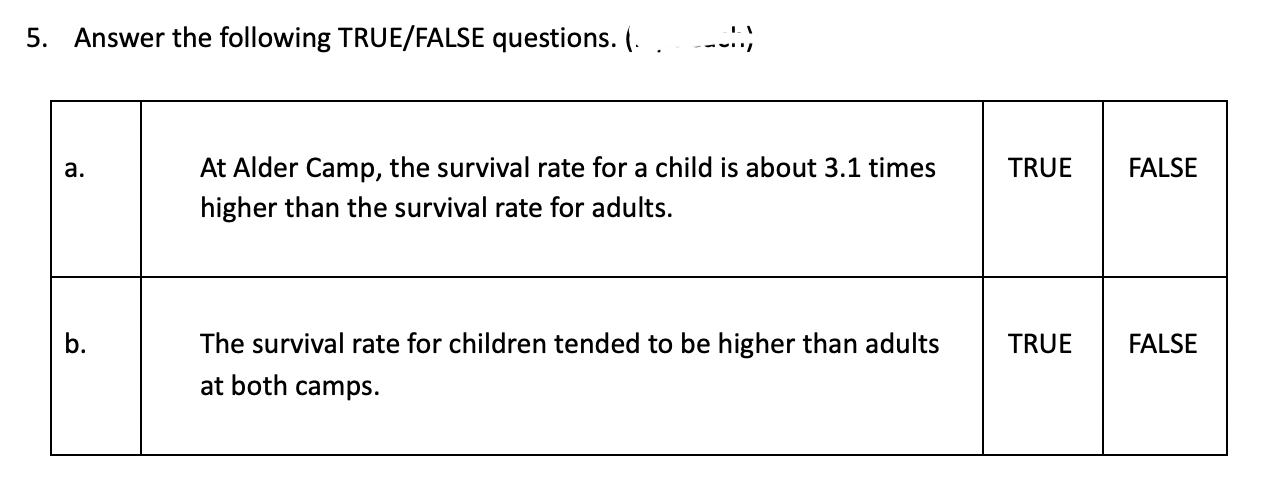
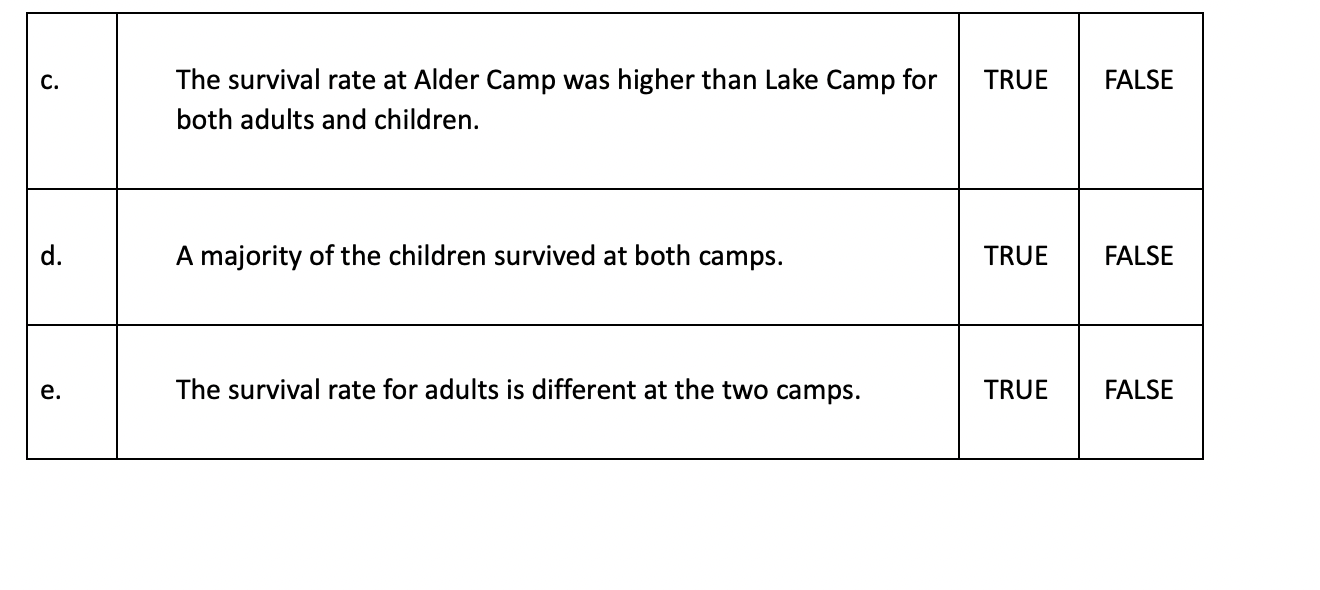
.: centered on information regarding the Donner Party, which was a group of folks who traveled west during the California Gold Rush of the late 1840's. This group got caught by early snowfall and had to spend much of the winter in the mountains in eastern California. Many of the people in this party did not survive the winter. Consider the survival rate across the Child / Adult variable. The goal here is to compare and contrast the survival rate of children vs. adults. Trapped in ID Name Age (Yrs) Age Group Child / Adult Gender Date Joined Mountains Camp Survived Dat 1 George Donner 60 40-60 Adult Male 07/19/1846 Yes Alder Camp No 03/ N 2 Tamsen Donner 45 40-60 Adult Female 07/19/1846 Yes Alder Camp No 03/1 W 3 Frances Donner 6 0-9 Child Female 07/19/1846 Yes Alder Camp Yes 4 Georgia Donner 4 0-9 Child Female 07/19/1846 Yes Alder Camp Yes un 5 Eliza Donner 3 0-9 Child Female 07/19/1846 Yes Alder Camp Yes 6 Elitha Cumi Donn... 13 10-19 Child Female 07/19/1846 Yes Alder Camp Yes 7 Leanna Donner 11 10-19 Child Female 07/19/1846 Yes Alder Camp Yes 8 8 Jacob Donner 56 40-60 Adult Male 07/19/1846 Yes Alder Camp No 12/1. To begin, investigate the relationship between survival rate and the Child / Adult variable. Select Analyze > Fit Y by X and specify the following. 0 Response Variable: Survived a Predictor Variable: Child [Adult Provide a screen-shot of the mosaic plot and the contingency table for your investigation. ( Delete my sample and replace it with your screenshot. IMHO! III] \"'75 - 2. Answer the following questions. i- , a. What is the risk of death for an Adult? b. What is the risk of death for a Child? 3. Compute the appropriate relative risk ratio to compare the risks of death computed in problem #2. Carefully interpret this relative risk ratio. (1-. . Relative Risk Ratio: Interpretation: 4. Compute the appropriate relative risk difference to compare the risks of death computed in problem #2. Carefully interpret this relative risk ratio. t _ Relative Risk Difference: Interpretation: Members ofthe Donner Party were located in two different camps on the mountain - Alder Camp had 23 people and Lake Camp had 59 people. Recreate the following graphics in JMP. Investigate the relationship between survival rate and the Child / Adult variable for the Alder Camp and Lake Camp. Select Analyze > Fit Y by X and specify the following. 9 Response Variable: Survived o Predictor Variable: Child [Adult 0 Include a local data filter for Camp. Select Alder Camp and take a screen-shot. Then select Lake Camp and take a screen-shot. Replace my screen-shots with yours in the table below. Alder Camp 4Local Data Filter 4Contingency Analysis of Survived By Child / Adult Clear Favorites 4 Mosaic Plot Show Include 1.00 23 matching rows Inverse Camp (3) X 0.75 ??? 7 Alder Camp 23 SAMPLE Lake Camp 59 Survived AND OR 0.25 0.00 Adult Child Child / Adult Lake Camp Local Data Filter 4Contingency Analysis of Survived By Child / Adult Clear Favorites 4 Mosaic Plot Show Include 1.00 59 matching rows Inverse Camp (3) X 0.75- ??? 7 Alder Camp 23 SAMPLE Lake Camp 59 Survived AND OR 0.25 0.00 Adult Child Child / Adult5. Answer the following TRUE/FALSE questions. (. ' -__!'.) At Alder Camp, the survival rate for a child is about 3.1 times TRUE FALSE higher than the survival rate for adults. The survival rate for children tended to be higher than adults TRUE FALSE at both camps. The survival rate at Alder Camp was higher than Lake Camp for TRUE FALSE both adults and children. A majority of the children survived at both camps. TRUE FALSE The survival rate for adults is different at the two camps. TRUE FALSE
