Question
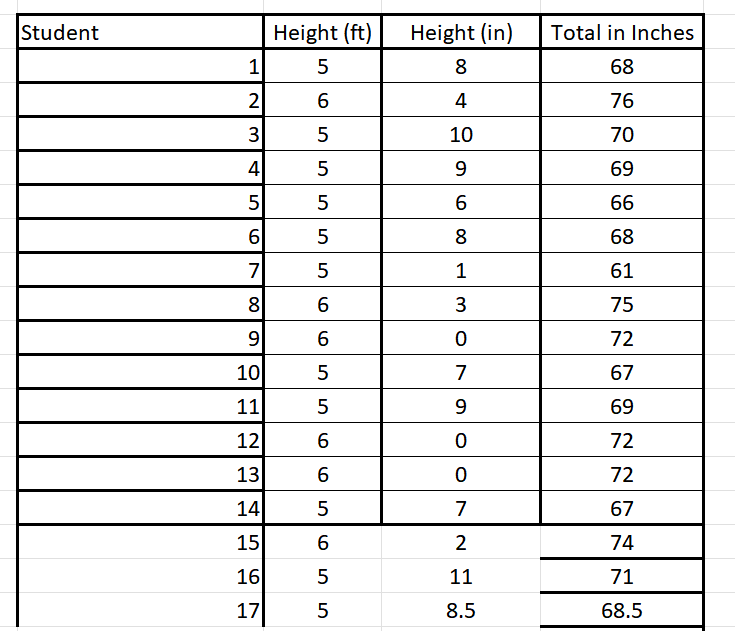
This is an exercise to see if the heights of the students in the class follows a normal distribution. Create histogram of the class height
This is an exercise to see if the heights of the students in the class follows a normal distribution.
Create histogram of the class height distribution. You can decide to drop any outliers. If you drop any, list the height and why you decided to drop it. Do not drop more than 2 heights.
Use the ?2 Goodness of Fit Test to determine whether the heights follow a normal distribution. Show your work.
Comment on the results. Specifically, does the histogram give you an indication of the actual distribution? Does the ?2 Goodness of Fit Test confirm or go against what you expected?

Student 1 2 3 4 5 6 700 8 9 10 11 12 13 456 14 15 16 17 Height (ft) 5 6 5 5 55 5 5 5 6 6 5 5 66 5 6 5 5 Height (in) 8 4 10 9 6 8 1 3 0 7 9 0 0 7 2 11 8.5 Total in Inches 68 76 70 69 66 68 61 75 72 67 69 72 72 67 74 71 68.5
Step by Step Solution
There are 3 Steps involved in it
Step: 1

Get Instant Access to Expert-Tailored Solutions
See step-by-step solutions with expert insights and AI powered tools for academic success
Step: 2

Step: 3

Ace Your Homework with AI
Get the answers you need in no time with our AI-driven, step-by-step assistance
Get Started


