Question
This is completed in R ### Allowable packages the only allowable packages are `tidyverse`, `psych` and `lm.beta`. ### Data Set - These data come from
This is completed in R
### Allowable packages
the only allowable packages are `tidyverse`, `psych` and `lm.beta`.
### Data Set
- These data come from the [Centers for Disease Control and Prevention](www.cdc.gov)
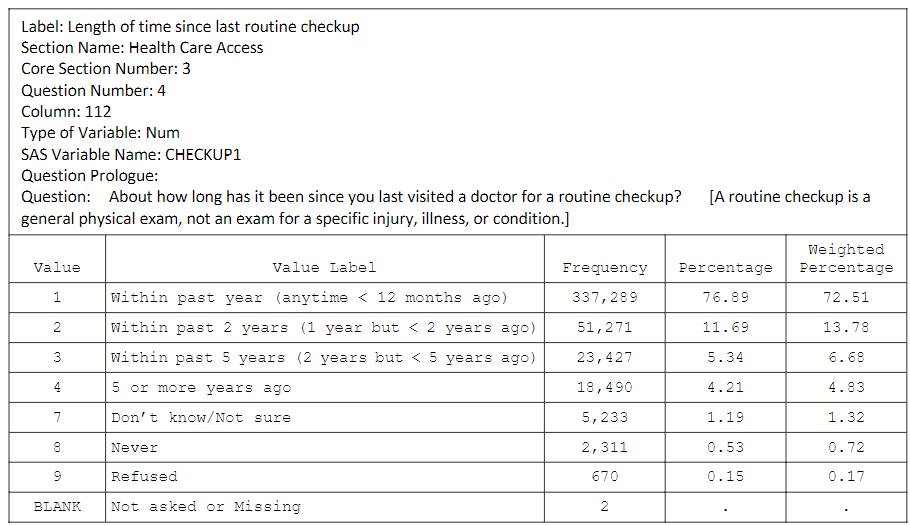
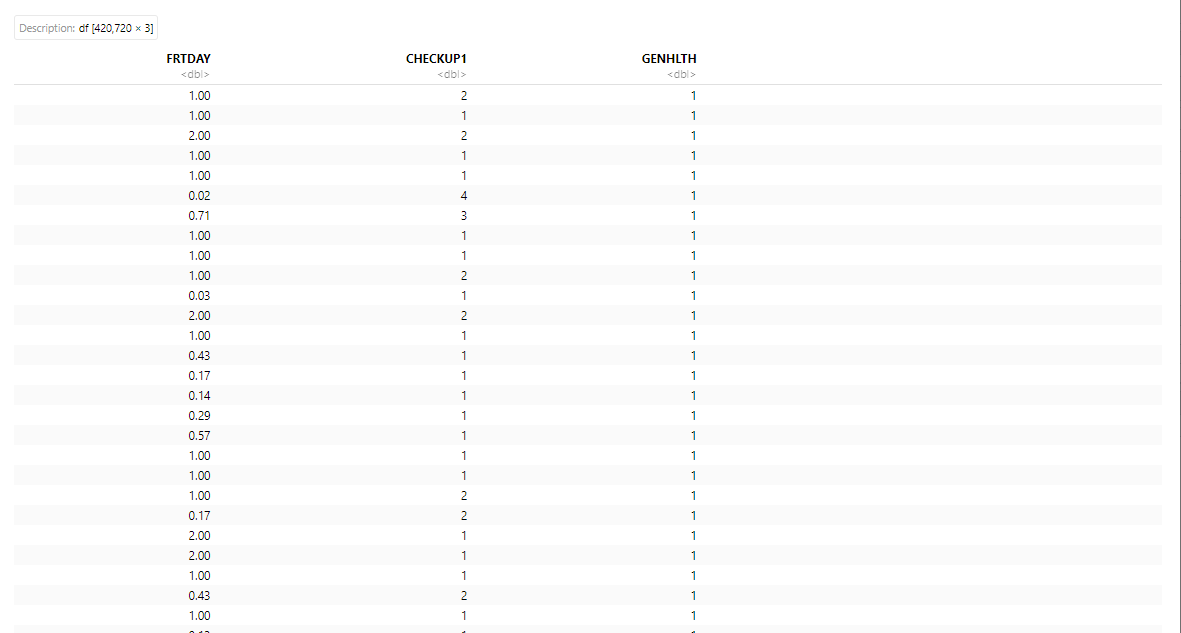
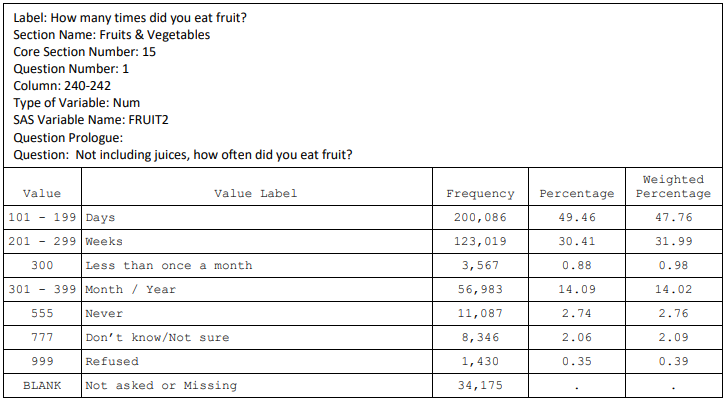
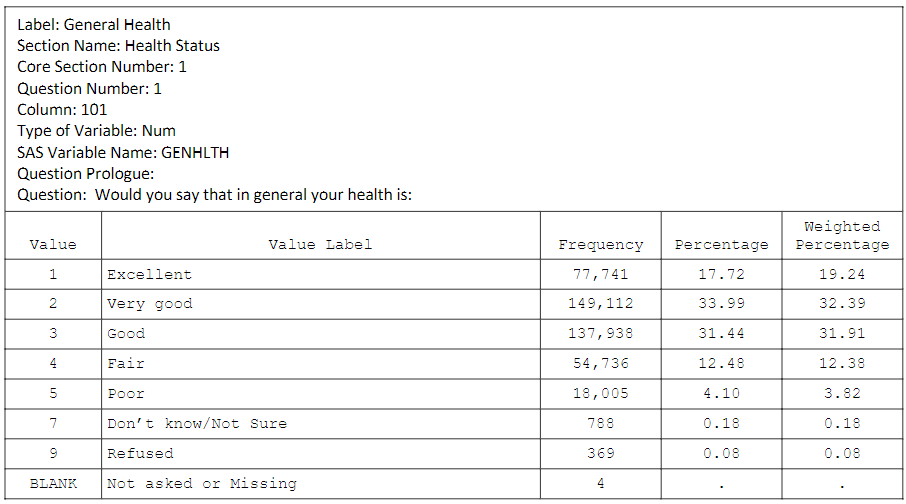
### Q8: Generate a regression predicting general health based on both number of fruits consumed per day and the length of time since last checkup (in that order). Analyze the summary of the model. How would you assess this model? Store the summary of the standardized regression coefficients in `Q8.`
Hint: The resulting summary output should look like this:
```
Call:
[...]
Residuals:
Min 1Q Median 3Q Max
Coefficients:
Estimate Standardized Std. Error t value Pr(>|t|)
(Intercept) 2.672440
FRTDAY
[...]2
[...]3
[...]4
[...]8
---
Signif. codes: 0 '***' 0.001 '**' 0.01 '*' 0.05 '.' 0.1 ' ' 1
Residual standard error:
Multiple R-squared:
F-statistic:
### Q9: Generate two new columns in `brf_part1` with binary data. For any health level of very good or excellent, set the value to 1; otherwise, a 0. Call this `binHealth`. For any person attending a checkup within the past year, set to a value of 1; otherwise, 0. Call this `binCheckup`. With the updated dataframe, perform a logistic regression to predict the likelihood of an individual's general health being very good or excellent based on `FRTDAY` and `binCheckup.` Store the summary of the regression coefficients in `Q9.`
Hint: The resulting summary output should look like this:
```
Call:
glm(...)
Coefficients:
Estimate Std. Error z value Pr(>|z|)
(Intercept) 0.175875
FRTDAY
binCheckup1
---
Signif. codes:
0 '***' 0.001 '**' 0.01 '*' 0.05 '.' 0.1 ' ' 1
(Dispersion parameter for binomial family taken to be 1)
Null deviance:
Residual deviance:
AIC:
Number of Fisher Scoring iterations:
### Q10: Generate a dataframe with data on five new individuals, shown in the table below. Then use your logistic regression model above and this new data to predict the likelihood of each individual would respond that they are in very good or excellent health. Use the `predict()` function. Round predictions to 2 decimal places. Store the predictions in `Q10`.
| ID | FRTDAY | binCheckup |
|---------|--------|------------|
| Person1 | 0 | 0 |
| Person2 | 1 | 0 |
| Person3 | 2 | 0 |
| Person4 | 3 | 1 |
| Person5 | 6 | 1 |
Hint 1: As a binary variable, binCheckup should *not* be coded as numeric.
Hint 2: The prediction output should look like this:
```
1 2 3 4 5
0.18
```


Step by Step Solution
There are 3 Steps involved in it
Step: 1

Get Instant Access to Expert-Tailored Solutions
See step-by-step solutions with expert insights and AI powered tools for academic success
Step: 2

Step: 3

Ace Your Homework with AI
Get the answers you need in no time with our AI-driven, step-by-step assistance
Get Started


