Answered step by step
Verified Expert Solution
Link Copied!

Question

1 Approved Answer

This is data https://drive.google.com/file/d/1sz32tfzRPM1DgkDpm57ZL2pwVHYrG0oN/view?usp=sharing Run this code in R # Upload the epa data set # call the dataset cardata cardata = read.csv(file.choose(), header =

This is data

https://drive.google.com/file/d/1sz32tfzRPM1DgkDpm57ZL2pwVHYrG0oN/view?usp=sharing

Run this code in R

# Upload the epa data set

# call the dataset cardata

cardata = read.csv(file.choose(), header = TRUE)

View(cardata)

# This one is side by side boxplot

boxplot(FiveYearEstimatedCost~Guzzler, data = cardata,

main = "add title",

xlab = "add horizontal axis name",

col = c("red", "green"), ### add different color names

horizontal = TRUE)

# Calculate the mean, sd and sample sizes for five year fuel cost split among Guzzler and no Guzzler

# the command aggregate() will perform the given function on the specified groups

# aggregate(response~treatment, data = datasetname, function)

# Make a table of values with the results.

aggregate(FiveYearEstimatedCost~Guzzler, data = cardata, mean)

aggregate(FiveYearEstimatedCost~Guzzler, data = cardata, sd)

aggregate(FiveYearEstimatedCost~Guzzler, data = cardata, length)

# What type of vehicles are Guzzlers? Find out by subsetting the dataset to only include Guzzlers.

GuzzlersOnly = subset(cardata, Guzzler == "Guzzler")

View(GuzzlersOnly)

# Perform a two sample t test

# Use the same response~treatment format as the functions above.

# t.test(response~treatment, data = datasetname, conf.level = enterconfidencelevel, alternative = "two.sided" ))

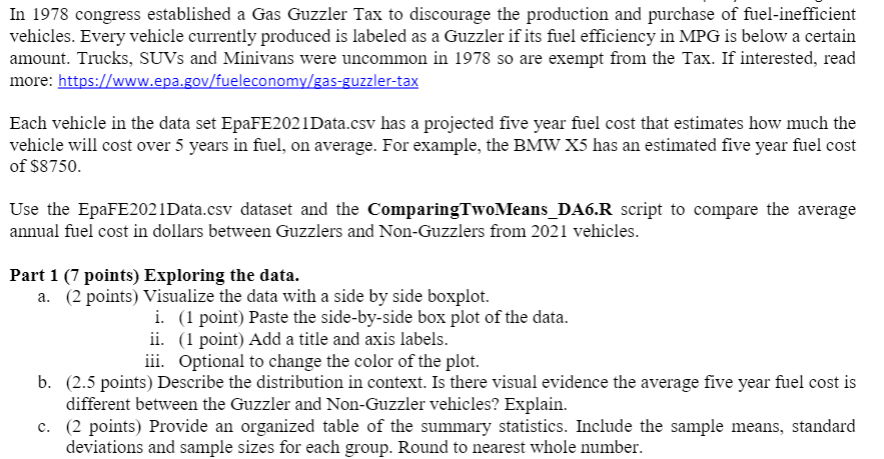
image text in transcribedimage text in transcribed
MAN STANDARD SAMPLE DEVIATION SIZE GUZZLER NON-GUZZLER d. {0.5 point) What type of vehicles are guzzlers? In 1978 congress established a Gas Guzzler Tax to discourage the production and purchase of fuel-inefcient vehicles. Every vehicle currently produced is labeled as a Guzzler if its fuel efficiency in MPG is below a certain amount. Trucks, SUVs and Minivans were uncommon in 1978 so are exempt from the Tax. If interested, read more: htt s: www.e a. ov fueleconom as uzzlertax Each vehicle in the data set EpaFEZOllDatacsv has a projected ve year fuel cost that estimates how much the vehicle will cost over 5 years in fuel, on average. For example, the BMW X5 has an estimated ve year fuel cost of $3750. Use the EpaFEEOZlData.csv dataset and the ComparingTwoMeans_DA6.R script to compare the average annual fuel cost in dollars between Guzzlers and Non-Guzzlers from 202 1 vehicles. Part 1 (7 points) Exploring the data. a. (2 points) Visualize the data with a side by side boxplot. i. (1 point) Paste the side-by-side box plot of the data. ii. (1 point) Add a title and axis labels. iii. Optional to change the color of the plot. b. (2.5 points) Describe the distribution in context. Is there visual evidence the average ve year fuel cost is different between the Guzzler and Non-Guzzler vehicles? Explain. c. (2 points) Provide an organized table of the summary statistics. Include the sample means, standard deviations and sample sizes for each group. Round to nearest whole number

Step by Step Solution

There are 3 Steps involved in it

Step: 1

blur-text-image

Get Instant Access to Expert-Tailored Solutions

See step-by-step solutions with expert insights and AI powered tools for academic success

Step: 2

blur-text-image_2

Step: 3

blur-text-image_3

Ace Your Homework with AI

Get the answers you need in no time with our AI-driven, step-by-step assistance

Get Started

Recommended Textbook for

An Introduction to the Mathematics of financial Derivatives

Authors: Salih N. Neftci

2nd Edition

978-0125153928, 9780080478647, 125153929, 978-0123846822

More Books

Students also viewed these Mathematics questions