

Question: this is due by midnight! any help would be appreciated 1. Use Pivot Table to summarize data in Frequency and Relative Frequency (Hint: Define classification
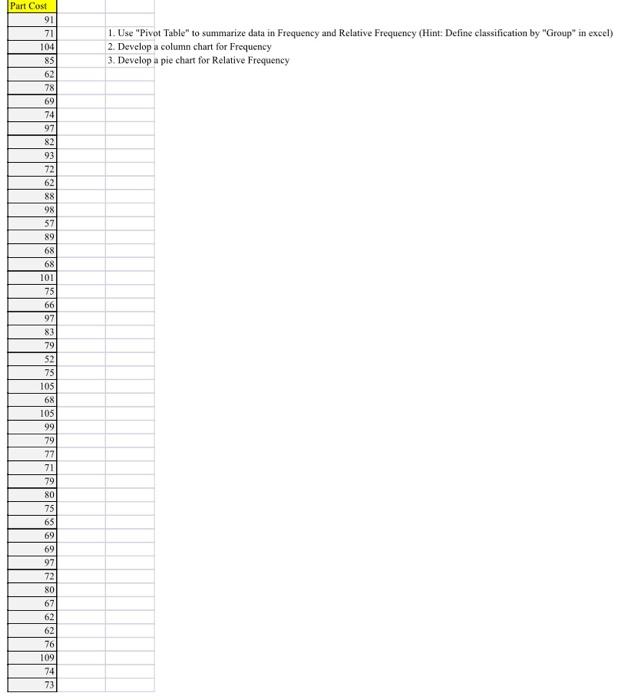
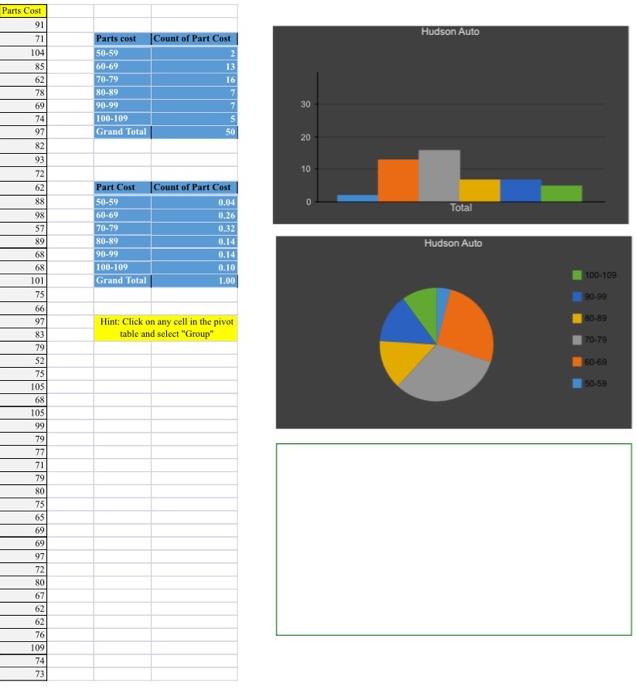
1. Use "Pivot Table" to summarize data in Frequency and Relative Frequency (Hint: Define classification by "Group" in excel) 2. Develop a column chart for Frequency 3. Develop a pie chart for Relative Frequency Part Cost 91 71 104 85 62 78 69 74 97 82 93 72 62 88 98 57 89 68 68 101 75 66 97 83 79 52 75 105 68 105 99 79 77 71 79 80 75 65 69 69 97 72 80 67 62 62 76 109 74 73 Parts Cost 91 Hudson Auto 71 Count of Part Cost 2 13 16 104 85 62 78 69 74 97 Parts cost 50-59 60-69 70-79 80-89 90.90 100-109 Grand Total 30 50 20 10 0 Total 82 93 72 62 88 98 57 89 68 68 101 75 66 Part Cost 50-59 60-69 70-79 80-89 90-99 100-109 Grand Total Count of Part Cost 0.04 0.26 0.32 0.14 0.14 0.10 1.00 Hudson Auto 100-109 97 Hint: Click on any cell in the pivot table and select "Group" 70-70 60-69 83 79 52 75 105 68 105 99 79 77 71 79 80 75 65 69 69 97 72 80 67 62 62 76 109 74 73
Step by Step Solution
There are 3 Steps involved in it

Get step-by-step solutions from verified subject matter experts