Answered step by step
Verified Expert Solution
Question
1 Approved Answer
This is Everything they gave us. They want us to write the code: The dataframe for your team is called your_team_df. The variable 'pts' represents
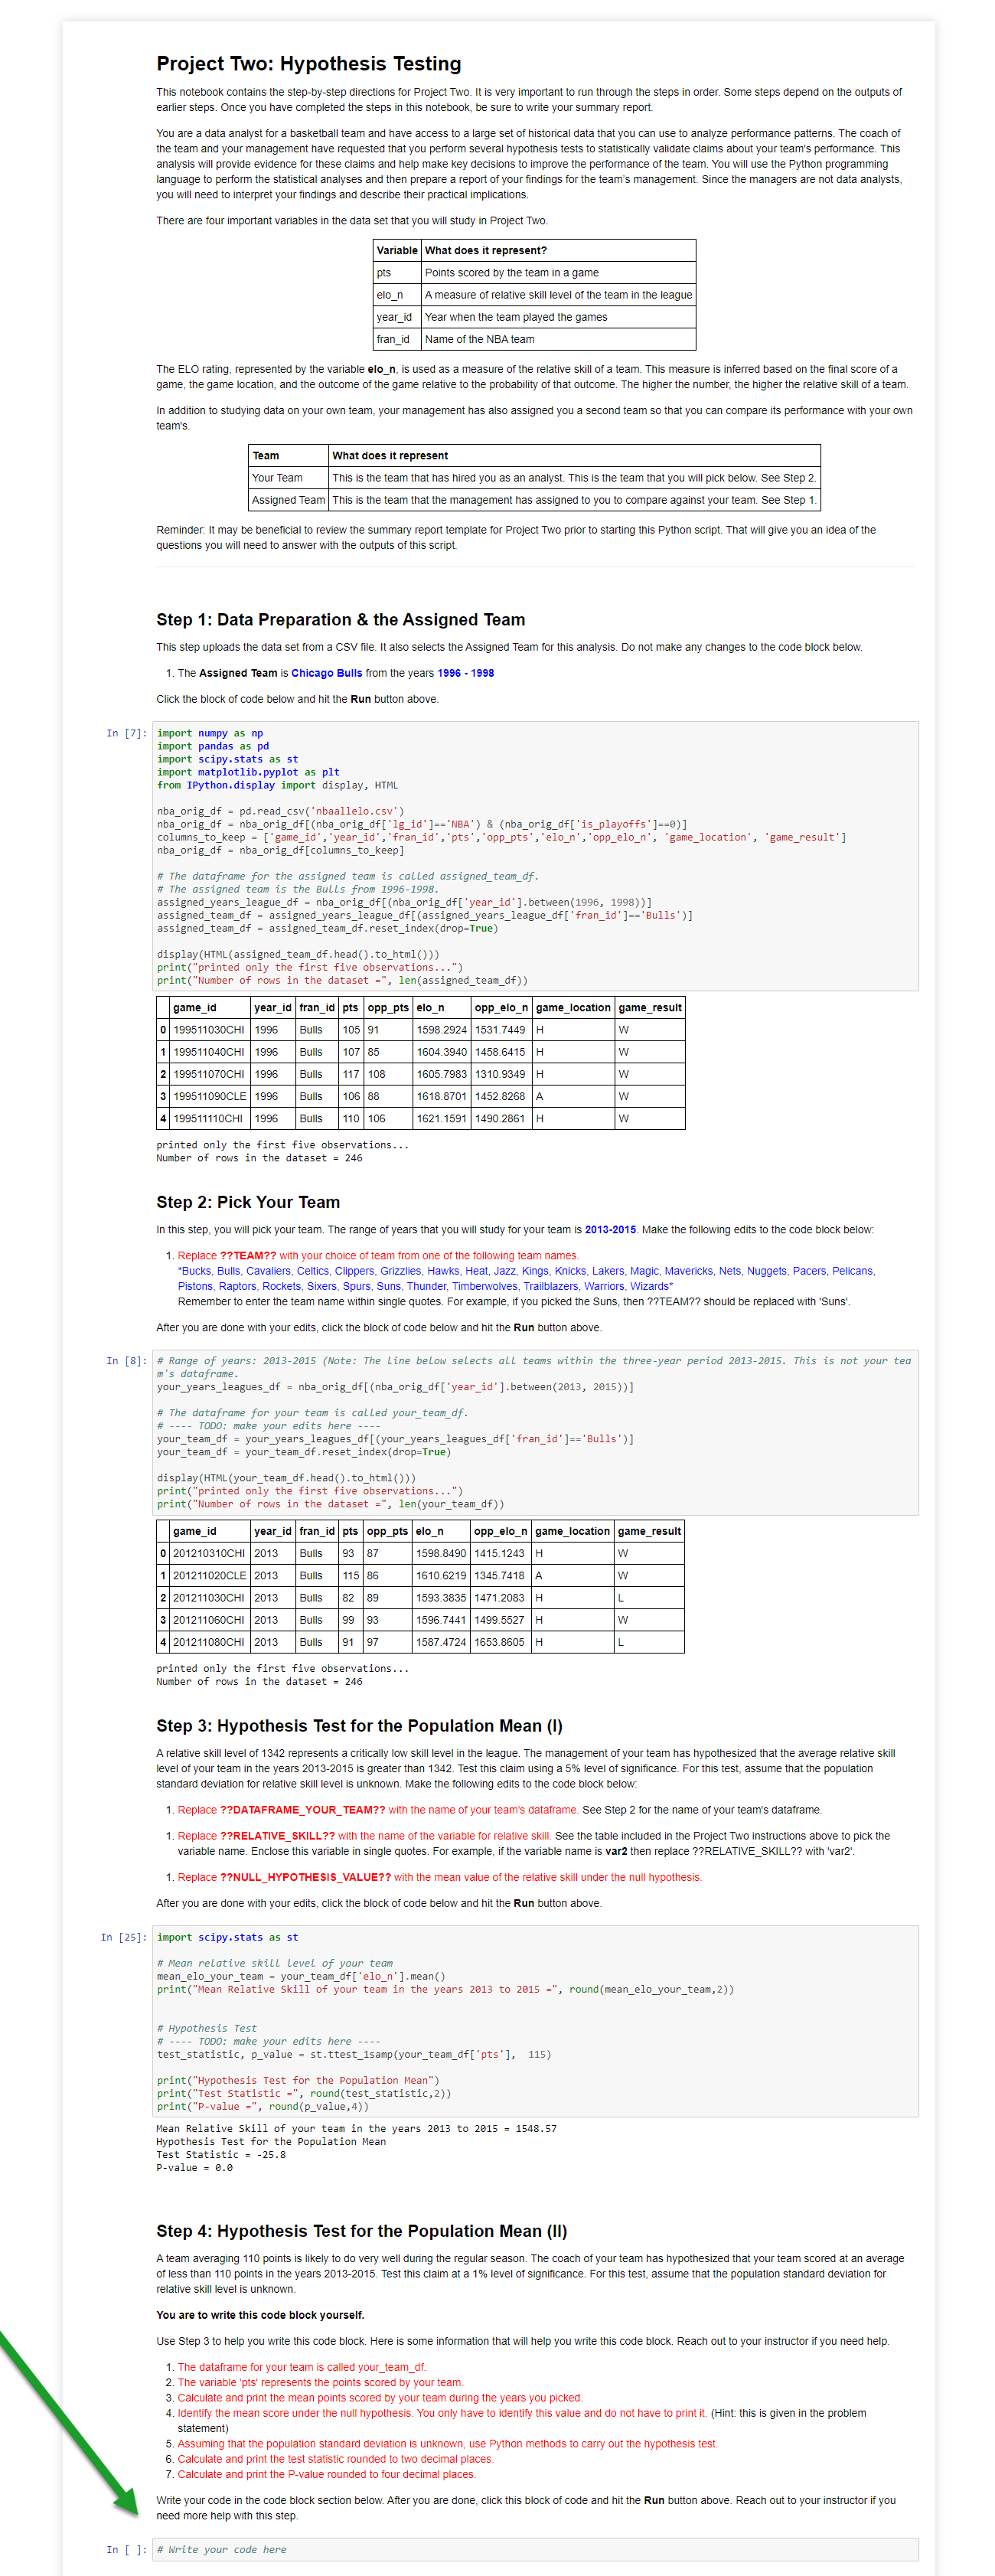
This is Everything they gave us. They want us to write the code:
- The dataframe for your team is called your_team_df.
- The variable 'pts' represents the points scored by your team.
- Calculate and print the mean points scored by your team during the years you picked.
- Identify the mean score under the null hypothesis. You only have to identify this value and do not have to print it. (Hint: this is given in the problem statement)
- Assuming that the population standard deviation is unknown, use Python methods to carry out the hypothesis test.
- Calculate and print the test statistic rounded to two decimal places.
- Calculate and print the P-value rounded to four decimal places.
Please let me know what other information you need or if you just could not see the picture.
Project Two: Hypothesis Testing This notebook contains the step-by-step directions for Project Two. It is very important to run through the steps in order. Some steps depend on the outputs of earlier steps. Once you have completed the steps in this notebook, be sure to write your summary report. You are a data analyst for a basketball team and have access to a large set of historical data that you can use to analyze performance patterns. The coach of the team and your management have requested that you perform several hypothesis tests to statistically validate claims about your team's performance. This analysis will provide evidence for these claims and help make key decisions to improve the performance of the team. You will use the Python programming language to perform the statistical analyses and then prepare a report of your findings for the team's management. Since the managers are not data analysts, you will need to interpret your findings and describe their practical implications. There are four important variables in the data set that you will study in Project Two. Variable What does it represent? pts Points scored by the team in a game elo_n A measure of relative skill level of the team in the league year_id Year when the team played the games fran_id Name of the NBA team The ELO rating, represented by the variable elo_n, is used as a measure of the relative skill of a team. This measure is inferred based on the final score of a game, the game location, and the outcome of the game relative to the probability of that outcome. The higher the number, the higher the relative skill of a team. In addition to studying data on your own team, your management has also assigned you a second team so that you can compare its performance with your own team's. Team What does it represent Your Team This is the team that has hired you as an analyst. This is the team that you will pick below. See Step 2. Assigned Team This is the team that the management has assigned to you to compare against your team. See Step 1. Reminder: It may be beneficial to review the summary report template for Project Two prior to starting this Python script. That will give you an idea of the questions you will need to answer with the outputs of this script. Step 1: Data Preparation & the Assigned Team This step uploads the data set from a CSV file. It also selects the Assigned Team for this analysis. Do not make any changes to the code block below. 1. The Assigned Team is Chicago Bulls from the years 1996 - 1998 Click the block of code below and hit the Run button above. In [7]: import numpy as np import pandas as pd import scipy.stats as st import matplotlib.pyplot as plt from IPython.display import display, HTML nba_orig_df = pd.read_csv ('nbaallelo.csv') nba_orig_df = nba_orig_df[(nba_orig_df['1g_id' ]=='NBA') & (nba_orig_df['is_playoffs']==0)] columns_to_keep = ['game_id', 'year_id', 'fran_id', 'pts', 'opp_pts', 'elo_n', 'opp_elo_n', 'game_location', 'game_result'] nba_orig_df = nba_orig_df [columns_to_keep] # The dataframe for the assigned team is called assigned_team_df. # The assigned team is the Bulls from 1996-1998. assigned_years_league_df = nba_orig_df[(nba_orig_df['year_id'].between(1996, 1998))] assigned_team_df = assigned_years_league_df[(assigned_years_league_df ['fran_id'] =='Bulls')] assigned_team_df = assigned_team_df.reset_index(drop=True) display (HTML (assigned_team_df.head().to_html()) print("printed only the first five observations...") print("Number of rows in the dataset =", len(assigned_team_df)) game_id year_id fran_id pts opp_pts elo_n opp_elo_n game_location game_result 0199511030CHI 1996 Bulls 10591 1598.2924 1531.7449 H W 1199511040CHI 1996 Bulls 10785 1604.39401458.6415 H W 2 199511070CHI 1996 Bulls 117 | 108 1605.79831310.9349 H w 3 199511090CLE 1996 Bulls 106 88 1618.8701 1452.8268 A w 4 19951111OCHI 1996 Bulls 110 106 1621.1591 1490.2861 H W printed only the first five observations... Number of rows in the dataset = 246 Step 2: Pick Your Team In this step, you will pick your team. The range of years that you will study for your team is 2013-2015. Make the following edits to the code block below: 1. Replace ?? TEAM?? with your choice of team from one of the following team names. *Bucks, Bulls, Cavaliers, Celtics, Clippers, Grizzlies, Hawks, Heat, Jazz, Kings, Knicks, Lakers, Magic, Mavericks, Nets, Nuggets, Pacers, Pelicans, Pistons, Raptors, Rockets, Sixers, Spurs, Suns, Thunder, Timberwolves, Trailblazers, Warriors, Wizards Remember to enter the team name within single quotes. For example, if you picked the Suns, then ??TEAM?? should be replaced with 'Suns'. After you are done with your edits, click the block of code below and hit the Run button above. In [8]: # Range of years: 2013-2015 (Note: The Line below selects all teams within the three-year period 2013-2015. This is not your tea m's dataframe. your_years_leagues_df = nba_orig_df[(nba_orig_df['year_id' ].between (2013, 2015))] # The dataframe for your team is called your_team_df. # ---- TODO: make your edits here ---- your_team_df = your_years_leagues_df[(your_years_leagues_df['fran_id'] =='Bulls')] your_team_df = your team_df.reset_index(drop=True) display (HTML (your_team_df.head().to_html()) print("printed only the first five observations...") print("Number of rows in the dataset =", len(your_team_df)) game_id year_id fran_id pts opp_pts elo_n opp_elo_n game_location game_result 0 201210310CHI 2013 Bulls 93 87 1598.8490 1415.1243 H w 1201211020CLE | 2013 Bulls 11586 1610.6219 1345.7418 A W 2 201211030CHI 2013 Bulls 82 89 1593.3835 1471.2083 H L 3 201211060CHI 2013 Bulls 99 93 1596.7441 1499.5527 H W 4201211080CHI 2013 Bulls 91 97 1587.4724 1653.8605 H printed only the first five observations... Number of rows in the dataset = 246 Step 3: Hypothesis Test for the population Mean (1) A relative skill level of 1342 represents a critically low skill level in the league. The management of your team has hypothesized that the average relative skill level of your team in the years 2013-2015 is greater than 1342. Test this claim using a 5% level of significance. For this test, assume that the population standard deviation for relative skill level is unknown. Make the following edits to the code block below: 1. Replace ??DATAFRAME_YOUR_TEAM?? with the name of your team's dataframe. See Step 2 for the name of your team's dataframe. 1. Replace ??RELATIVE_SKILL?? with the name of the variable for relative skill. See the table included in the Project Two instructions above to pick the variable name. Enclose this variable in single quotes. For example, if the variable name is var2 then replace ??RELATIVE SKILL?? with 'var2'. 1. Replace ??NULL_HYPOTHESIS_VALUE?? with the mean value of the relative skill under the null hypothesis. After you are done with your edits, click the block of code below and hit the Run button above. In [25]: import scipy.stats as st # Mean relative skill level of your team mean_elo_your_team = your_team_df['elo_n'].mean() print("Mean Relative Skill of your team in the years 2013 to 2015 =", round(mean_elo_your_team, 2)) # Hypothesis Test # ---- TODO: make your edits here ---- test_statistic, p_value = st.ttest_1samp (your_team_df['pts'], 115) print("Hypothesis Test for the population Mean") print("Test Statistic =", round(test_statistic, 2)) print("P-value =", round(p_value, 4)) Mean Relative Skill of your team in the years 2013 to 2015 = 1548.57 Hypothesis Test for the Population Mean Test Statistic = -25.8 P-value = 0.0 Step 4: Hypothesis Test for the population Mean (II) A team averaging 110 points is likely to do very well during the regular season. The coach of your team has hypothesized that your team scored at an average of less than 110 points in the years 2013-2015. Test this claim at a 1% level of significance. For this test, assume that the population standard deviation for relative skill level is unknown. You are to write this code block yourself. Use Step 3 to help you write this code block. Here is some information that will help you write this code block. Reach out to your instructor if you need help 1. The dataframe for your team is called your_team_df. 2. The variable 'pts' represents the points scored by your team. 3. Calculate and print the mean points scored by your team during the years you picked. 4. Identify the mean score under the null hypothesis. You only have to identify this value and do not have to print it. (Hint: this is given in the problem statement) 5. Assuming that the population standard deviation is unknown, use Python methods to carry out the hypothesis test. 6. Calculate and print the test statistic rounded to two decimal places 7. Calculate and print the P-value rounded to four decimal places Write your code in the code block section below. After you are done, click this block of code and hit the Run button above. Reach out to your instructor if you need more help with this step. In [ ]: # Write your code here Project Two: Hypothesis Testing This notebook contains the step-by-step directions for Project Two. It is very important to run through the steps in order. Some steps depend on the outputs of earlier steps. Once you have completed the steps in this notebook, be sure to write your summary report. You are a data analyst for a basketball team and have access to a large set of historical data that you can use to analyze performance patterns. The coach of the team and your management have requested that you perform several hypothesis tests to statistically validate claims about your team's performance. This analysis will provide evidence for these claims and help make key decisions to improve the performance of the team. You will use the Python programming language to perform the statistical analyses and then prepare a report of your findings for the team's management. Since the managers are not data analysts, you will need to interpret your findings and describe their practical implications. There are four important variables in the data set that you will study in Project Two. Variable What does it represent? pts Points scored by the team in a game elo_n A measure of relative skill level of the team in the league year_id Year when the team played the games fran_id Name of the NBA team The ELO rating, represented by the variable elo_n, is used as a measure of the relative skill of a team. This measure is inferred based on the final score of a game, the game location, and the outcome of the game relative to the probability of that outcome. The higher the number, the higher the relative skill of a team. In addition to studying data on your own team, your management has also assigned you a second team so that you can compare its performance with your own team's. Team What does it represent Your Team This is the team that has hired you as an analyst. This is the team that you will pick below. See Step 2. Assigned Team This is the team that the management has assigned to you to compare against your team. See Step 1. Reminder: It may be beneficial to review the summary report template for Project Two prior to starting this Python script. That will give you an idea of the questions you will need to answer with the outputs of this script. Step 1: Data Preparation & the Assigned Team This step uploads the data set from a CSV file. It also selects the Assigned Team for this analysis. Do not make any changes to the code block below. 1. The Assigned Team is Chicago Bulls from the years 1996 - 1998 Click the block of code below and hit the Run button above. In [7]: import numpy as np import pandas as pd import scipy.stats as st import matplotlib.pyplot as plt from IPython.display import display, HTML nba_orig_df = pd.read_csv ('nbaallelo.csv') nba_orig_df = nba_orig_df[(nba_orig_df['1g_id' ]=='NBA') & (nba_orig_df['is_playoffs']==0)] columns_to_keep = ['game_id', 'year_id', 'fran_id', 'pts', 'opp_pts', 'elo_n', 'opp_elo_n', 'game_location', 'game_result'] nba_orig_df = nba_orig_df [columns_to_keep] # The dataframe for the assigned team is called assigned_team_df. # The assigned team is the Bulls from 1996-1998. assigned_years_league_df = nba_orig_df[(nba_orig_df['year_id'].between(1996, 1998))] assigned_team_df = assigned_years_league_df[(assigned_years_league_df ['fran_id'] =='Bulls')] assigned_team_df = assigned_team_df.reset_index(drop=True) display (HTML (assigned_team_df.head().to_html()) print("printed only the first five observations...") print("Number of rows in the dataset =", len(assigned_team_df)) game_id year_id fran_id pts opp_pts elo_n opp_elo_n game_location game_result 0199511030CHI 1996 Bulls 10591 1598.2924 1531.7449 H W 1199511040CHI 1996 Bulls 10785 1604.39401458.6415 H W 2 199511070CHI 1996 Bulls 117 | 108 1605.79831310.9349 H w 3 199511090CLE 1996 Bulls 106 88 1618.8701 1452.8268 A w 4 19951111OCHI 1996 Bulls 110 106 1621.1591 1490.2861 H W printed only the first five observations... Number of rows in the dataset = 246 Step 2: Pick Your Team In this step, you will pick your team. The range of years that you will study for your team is 2013-2015. Make the following edits to the code block below: 1. Replace ?? TEAM?? with your choice of team from one of the following team names. *Bucks, Bulls, Cavaliers, Celtics, Clippers, Grizzlies, Hawks, Heat, Jazz, Kings, Knicks, Lakers, Magic, Mavericks, Nets, Nuggets, Pacers, Pelicans, Pistons, Raptors, Rockets, Sixers, Spurs, Suns, Thunder, Timberwolves, Trailblazers, Warriors, Wizards Remember to enter the team name within single quotes. For example, if you picked the Suns, then ??TEAM?? should be replaced with 'Suns'. After you are done with your edits, click the block of code below and hit the Run button above. In [8]: # Range of years: 2013-2015 (Note: The Line below selects all teams within the three-year period 2013-2015. This is not your tea m's dataframe. your_years_leagues_df = nba_orig_df[(nba_orig_df['year_id' ].between (2013, 2015))] # The dataframe for your team is called your_team_df. # ---- TODO: make your edits here ---- your_team_df = your_years_leagues_df[(your_years_leagues_df['fran_id'] =='Bulls')] your_team_df = your team_df.reset_index(drop=True) display (HTML (your_team_df.head().to_html()) print("printed only the first five observations...") print("Number of rows in the dataset =", len(your_team_df)) game_id year_id fran_id pts opp_pts elo_n opp_elo_n game_location game_result 0 201210310CHI 2013 Bulls 93 87 1598.8490 1415.1243 H w 1201211020CLE | 2013 Bulls 11586 1610.6219 1345.7418 A W 2 201211030CHI 2013 Bulls 82 89 1593.3835 1471.2083 H L 3 201211060CHI 2013 Bulls 99 93 1596.7441 1499.5527 H W 4201211080CHI 2013 Bulls 91 97 1587.4724 1653.8605 H printed only the first five observations... Number of rows in the dataset = 246 Step 3: Hypothesis Test for the population Mean (1) A relative skill level of 1342 represents a critically low skill level in the league. The management of your team has hypothesized that the average relative skill level of your team in the years 2013-2015 is greater than 1342. Test this claim using a 5% level of significance. For this test, assume that the population standard deviation for relative skill level is unknown. Make the following edits to the code block below: 1. Replace ??DATAFRAME_YOUR_TEAM?? with the name of your team's dataframe. See Step 2 for the name of your team's dataframe. 1. Replace ??RELATIVE_SKILL?? with the name of the variable for relative skill. See the table included in the Project Two instructions above to pick the variable name. Enclose this variable in single quotes. For example, if the variable name is var2 then replace ??RELATIVE SKILL?? with 'var2'. 1. Replace ??NULL_HYPOTHESIS_VALUE?? with the mean value of the relative skill under the null hypothesis. After you are done with your edits, click the block of code below and hit the Run button above. In [25]: import scipy.stats as st # Mean relative skill level of your team mean_elo_your_team = your_team_df['elo_n'].mean() print("Mean Relative Skill of your team in the years 2013 to 2015 =", round(mean_elo_your_team, 2)) # Hypothesis Test # ---- TODO: make your edits here ---- test_statistic, p_value = st.ttest_1samp (your_team_df['pts'], 115) print("Hypothesis Test for the population Mean") print("Test Statistic =", round(test_statistic, 2)) print("P-value =", round(p_value, 4)) Mean Relative Skill of your team in the years 2013 to 2015 = 1548.57 Hypothesis Test for the Population Mean Test Statistic = -25.8 P-value = 0.0 Step 4: Hypothesis Test for the population Mean (II) A team averaging 110 points is likely to do very well during the regular season. The coach of your team has hypothesized that your team scored at an average of less than 110 points in the years 2013-2015. Test this claim at a 1% level of significance. For this test, assume that the population standard deviation for relative skill level is unknown. You are to write this code block yourself. Use Step 3 to help you write this code block. Here is some information that will help you write this code block. Reach out to your instructor if you need help 1. The dataframe for your team is called your_team_df. 2. The variable 'pts' represents the points scored by your team. 3. Calculate and print the mean points scored by your team during the years you picked. 4. Identify the mean score under the null hypothesis. You only have to identify this value and do not have to print it. (Hint: this is given in the problem statement) 5. Assuming that the population standard deviation is unknown, use Python methods to carry out the hypothesis test. 6. Calculate and print the test statistic rounded to two decimal places 7. Calculate and print the P-value rounded to four decimal places Write your code in the code block section below. After you are done, click this block of code and hit the Run button above. Reach out to your instructor if you need more help with this step. In [ ]: # Write your code hereStep by Step Solution
There are 3 Steps involved in it
Step: 1

Get Instant Access to Expert-Tailored Solutions
See step-by-step solutions with expert insights and AI powered tools for academic success
Step: 2

Step: 3
Ace Your Homework with AI
Get the answers you need in no time with our AI-driven, step-by-step assistance
Get Started