

Question
This is for java My assignment is to write a class called Histogram. This program allows you to visually inspect the frequency distribution of a
This is for java
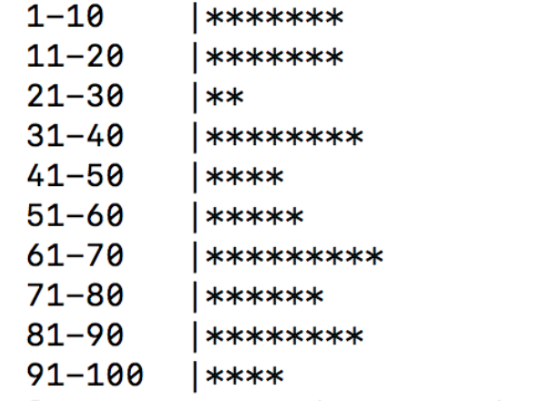
My assignment is to write a class called Histogram. This program allows you to visually inspect the frequency distribution of a set of values. The program should read in an arbitrary number of integers (50 or more) from a text input file (histogram.txt) that are in the range 1 to 100, inclusive. Then produce a chart similar to the one below that indicates how many input values fell in the range 1 to 10, 11 to 20, and so on. Print one asterisk for each value entered. Make sure that you use an array of ten integers (acting as counters) to solve this problem. Then at the end of the program, you just need to print out the number of asterisks for each counter.
For example
Step by Step Solution
There are 3 Steps involved in it
Step: 1

Get Instant Access to Expert-Tailored Solutions
See step-by-step solutions with expert insights and AI powered tools for academic success
Step: 2

Step: 3
Ace Your Homework with AI
Get the answers you need in no time with our AI-driven, step-by-step assistance
Get Started
Database And Expert Systems Applications 24th International Conference Dexa 2013 Prague Czech Republic August 2013 Proceedings Part 1 Lncs 8055
Authors: Hendrik Decker ,Lenka Lhotska ,Sebastian Link ,Josef Basl ,A Min Tjoa
2013 Edition
3642402844, 978-3642402845