

Question: This is for Marriott Case Compute the asset beta and cost of capital for Marriott Corporation as a whole. Be sure to justify your choice
This is for Marriott Case
Compute the asset beta and cost of capital for Marriott Corporation as a whole. Be sure to justify your choice of risk-free rate and a market risk premium.
I need help showing calculations for these.
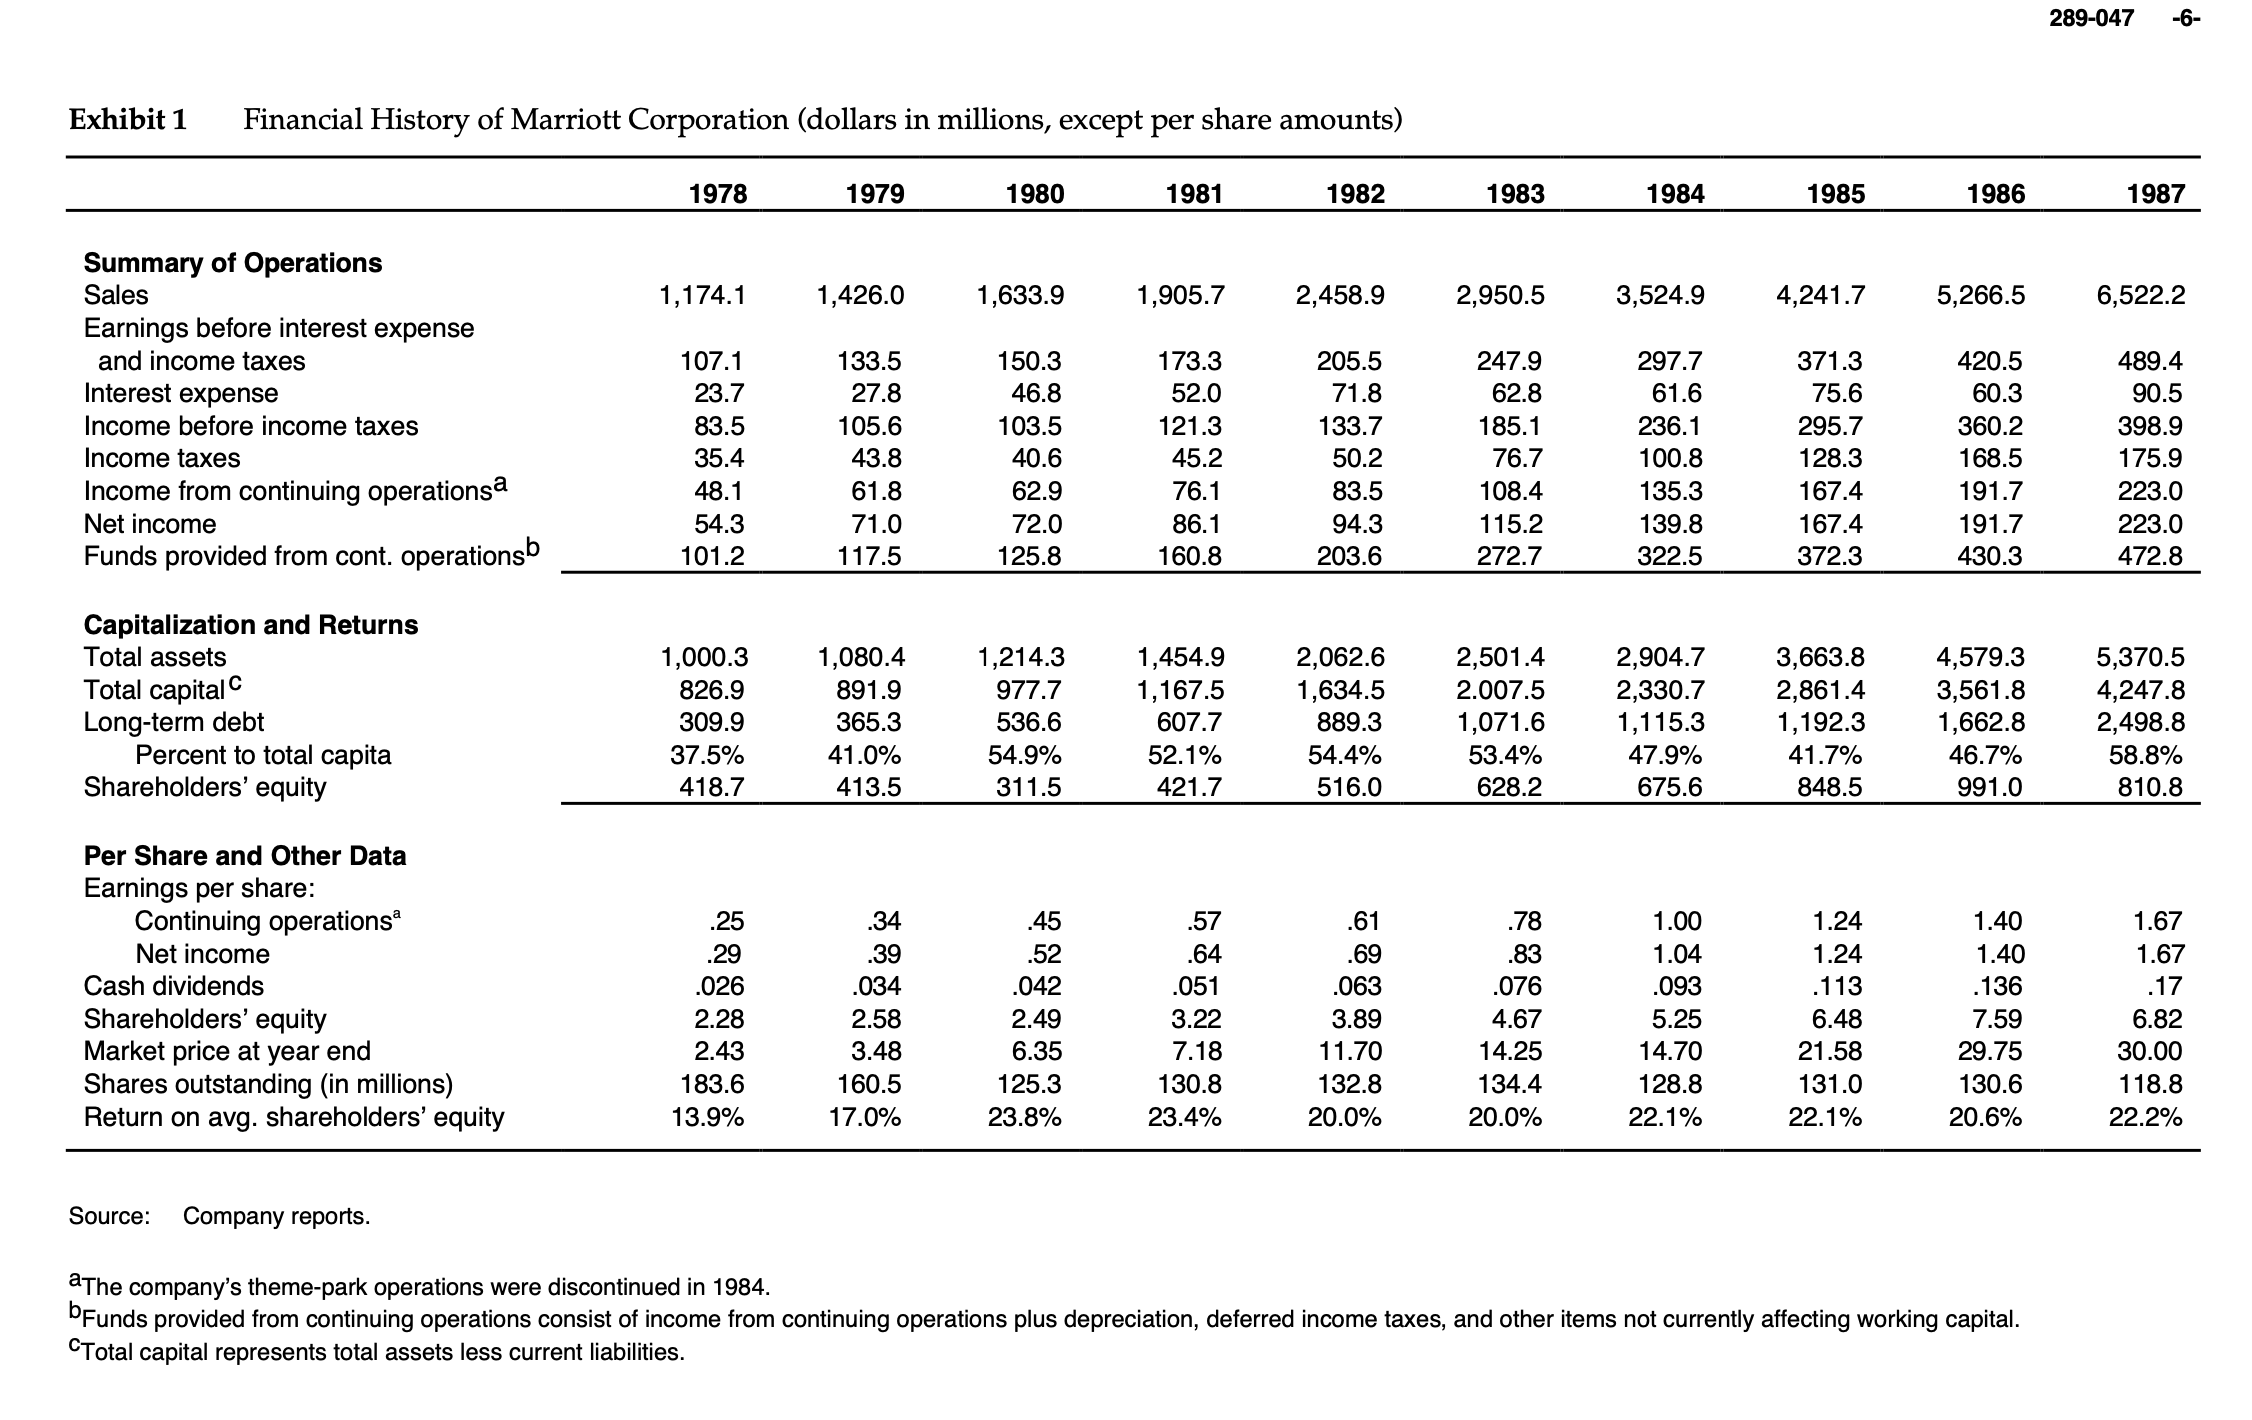
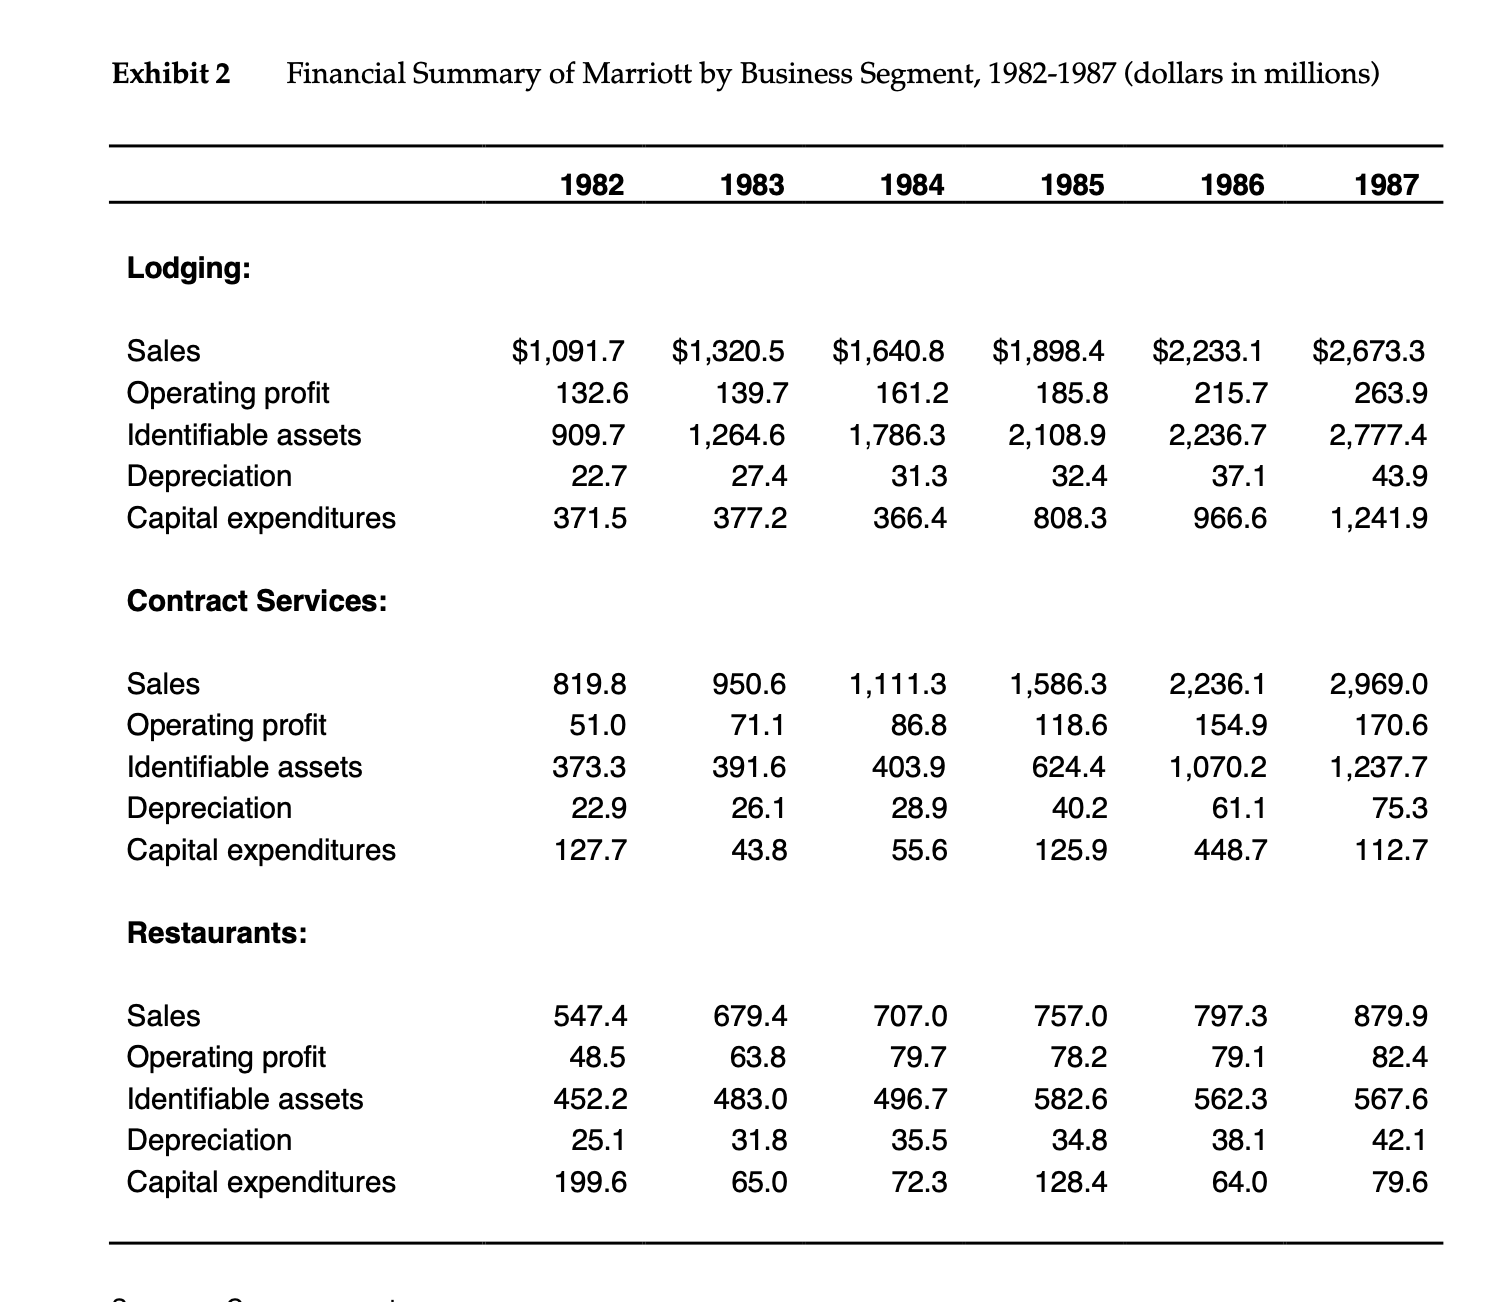
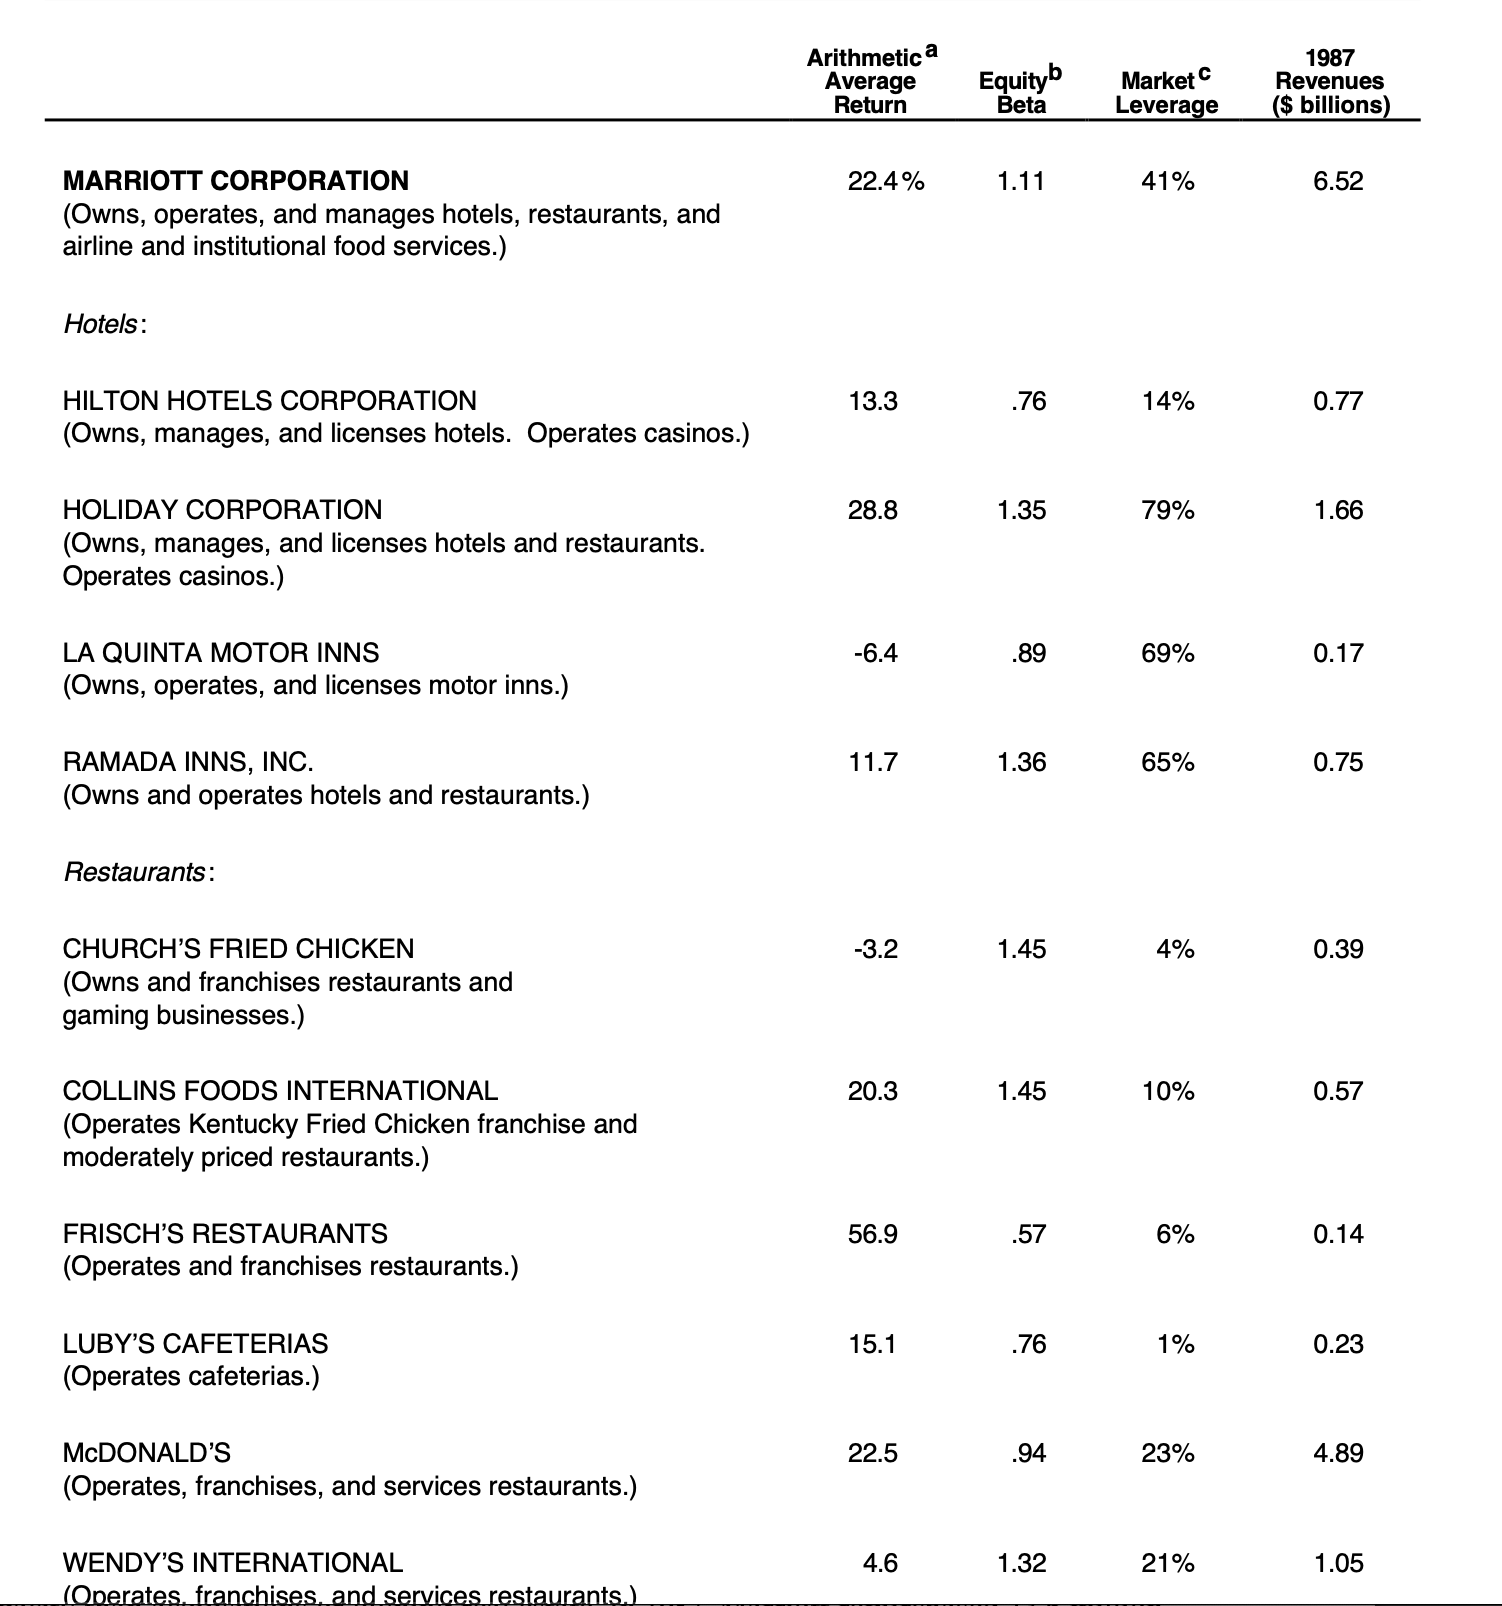
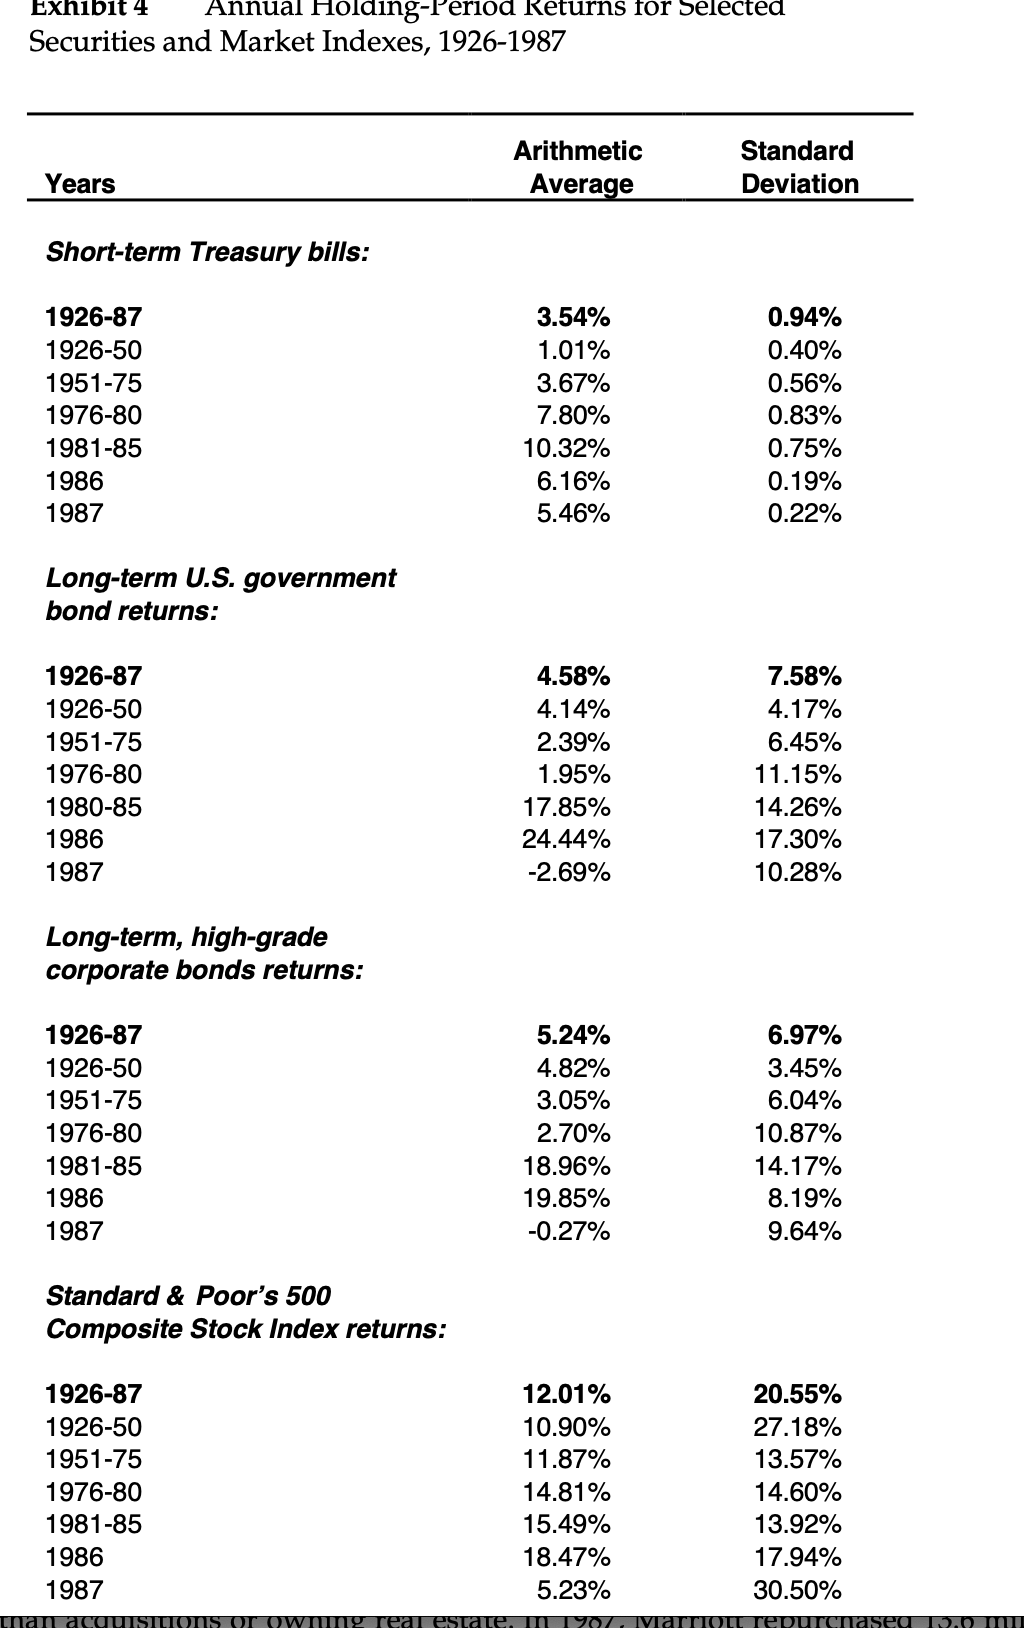
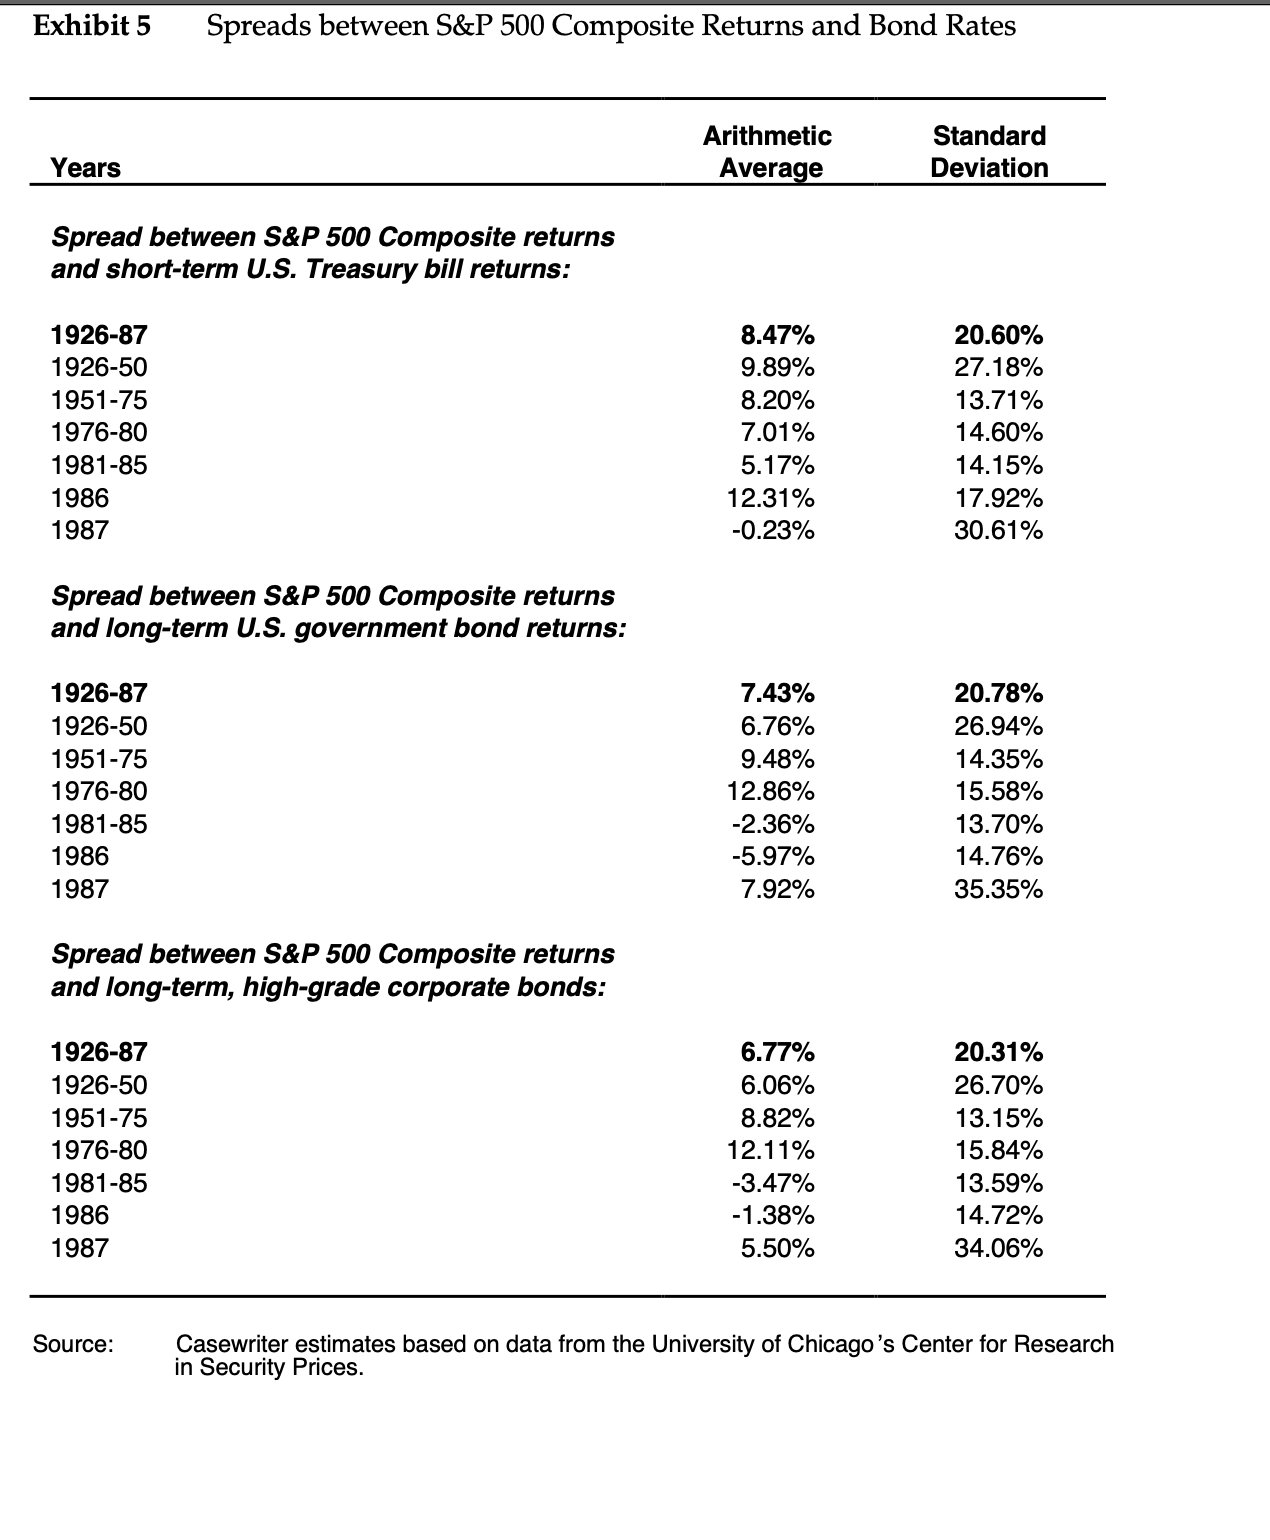
Exhibit 1 Financial History of Marriott Corporation (dollars in millions, except per share amounts) Summary of Operations Sales Earnings before interest expense and income taxes Interest expense Income before income taxes Income taxes Income from continuing operations3 Net income Funds provided from cont. operationsb Capitalization and Returns Total assets Total capital c Long-term debt Percent to total capita Shareholders' equity Per Share and Other Data Earnings per share: Continuing operations\" Net income Cash dividends Shareholders' equity Market price at year end Shares outstanding (in millions) Return on avg. shareholders' equity Source: Company reports. aThe company's theme-park operations were discontinued in 1984. 1978 1,174.1 107.1 23.7 83.5 35.4 48.1 54.3 101.2 1,000.3 826.9 309.9 37.5% 418.7 .25 .29 .026 2.28 2.43 183.6 13.9% 1979 1,426.0 133.5 27.8 105.6 43.8 61.8 71.0 117.5 1,080.4 891.9 365.3 41.0% 413.5 .39 .034 2.58 3.48 160.5 17.0% 1980 1,633.9 150.3 46.8 103.5 40.6 62.9 72.0 125.8 1,214.3 977.7 536.6 54.9% 311.5 .45 .52 .042 2.49 6.35 1 25.3 23.8% 1981 1,905.7 173.3 52.0 121.3 45.2 76.1 86.1 160.8 1,454.9 1,167.5 607.7 52.1% 421.7 .57 .64 .051 3.22 7.18 130.8 23.4% 1982 2,458.9 205.5 71 .8 133.7 50.2 83.5 94.3 203.6 2,062.6 1 ,634.5 889.3 54.4% 516.0 .61 .69 .063 3.89 1 1.70 132.8 20.0% 1 983 2,950.5 247.9 62.8 185.1 76.7 108.4 1 15.2 272.7 2,501.4 2.007.5 1,071.6 53.4% 628.2 .78 .83 .076 4.67 14.25 134.4 20.0% 1984 3,524.9 297.7 61 .6 236.1 100.8 135.3 139.8 322.5 2,904.7 2,330.7 1 ,115.3 47.9% 675.6 1 .00 1 .04 .093 5.25 14.70 128.8 22.1 % 1 985 4,241 .7 371 .3 75.6 295.7 128.3 167.4 167.4 372.3 3,663.8 2,861.4 1,192.3 41.7% 848.5 1.24 1.24 .113 6.48 21.58 131.0 22.1% 1986 5,266.5 420.5 60.3 360.2 168.5 191.7 191.7 430.3 4,579.3 3,561.8 1,662.8 46.7% 991.0 1 .40 1 .40 .136 7.59 29.75 130.6 20.6% t:'Funds provided from continuing operations consist of income from continuing operations plus depreciation, deferred income taxes, and other items not currently affecting working capital. CTotal capital represents total assets less current liabilities. 239-047 -6- 1 987 6,522.2 489.4 90.5 398.9 175.9 223.0 223.0 472.8 5,370.5 4,247.8 2,498.8 58.8% 810.8 1.67 1.67 .17 6.82 30.00 118.8 22.2% Exhibit 2 Financial Summary of Marriott by Business Segment, 1982-1987 (dollars in millions) Lodging: Sales Operating profit Identifiable assets Depreciation Capital expenditures Contract Services: Sales Operating profit Identifiable assets Depreciation Capital expenditures Restaurants: Sales Operating profit Identifiable assets Depreciation Capital expenditures 1 982 $1 ,091 .7 132.6 909.7 22.7 371 .5 819.8 51.0 373.3 22.9 127.7 547.4 48.5 452.2 25.1 199.6 1 983 $1 ,320.5 139.7 1,264.6 27.4 377.2 950.6 71.1 391.6 26.1 43.8 679.4 63.8 483.0 31.8 65.0 1 984 $1,640.8 161.2 1,786.3 31.3 366.4 1,111.3 86.8 403.9 28.9 55.6 707.0 79.7 496.7 35.5 72.3 1 985 $1,898.4 185.8 2,108.9 32.4 808.3 1,586.3 118.6 624.4 40.2 125.9 757.0 78.2 582.6 34.8 128.4 1 986 $2,233.1 215.7 2,236.7 37.1 966.6 2,236.1 154.9 1,070.2 61.1 448.7 797.3 79.1 562 .3 38.1 64.0 1987 $2,673.3 263.9 2,777.4 43.9 1 ,241.9 2,969.0 170.6 1,237.7 75.3 112.7 879.9 82.4 567.6 42.1 79.6 Arithmetic a 1987 Average Equityb Market C Revenues Return Beta Leverage ($ billions) MARRIOTT CORPORATION 22.4% 1.11 41% 6.52 Owns, operates, and manages hotels, restaurants, and airline and institutional food services.) Hotels: HILTON HOTELS CORPORATION 13.3 76 14% 0.77 (Owns, manages, and licenses hotels. Operates casinos.) HOLIDAY CORPORATION 28.8 1.35 79% 1.66 (Owns, manages, and licenses hotels and restaurants. Operates casinos.) LA QUINTA MOTOR INNS -6.4 89 69% 0.17 Owns, operates, and licenses motor inns.) RAMADA INNS, INC. 11.7 1.36 65% 0.75 Owns and operates hotels and restaurants.) Restaurants: CHURCH'S FRIED CHICKEN -3.2 1.45 4% 0.39 (Owns and franchises restaurants and gaming businesses. COLLINS FOODS INTERNATIONAL 20.3 1.45 10% 0.57 (Operates Kentucky Fried Chicken franchise and moderately priced restaurants.) FRISCH'S RESTAURANTS 56.9 57 6% 0.14 (Operates and franchises restaurants.) LUBY'S CAFETERIAS 15.1 76 1% 0.23 (Operates cafeterias.) MCDONALD'S 22.5 94 23% 4.89 (Operates, franchises, and services restaurants.) WENDY'S INTERNATIONAL 4.6 1.32 21% 1.05 Operates. franchises.Exhibit 4 Annual Holding-Period Returns for Selected Securities and Market Indexes, 1926-1987 Arithmetic Standard Years Average Deviation Short-term Treasury bills: 1926-87 3.54% 0.94% 1926-50 1.01% 0.40% 1951-75 3.67% 0.56% 1976-80 7.80% 0.83% 1981-85 10.32% 0.75% 1986 6.16% 0.19% 1987 5.46% 0.22% Long-term U.S. government bond returns: 1926-87 4.58% 7.58% 1926-50 4.14% 4.17% 1951-75 2.39% 6.45% 1976-80 1.95% 11.15% 1980-85 17.85% 14.26% 1986 24.44% 17.30% 1987 2.69% 10.28% Long-term, high-grade corporate bonds returns: 1926-87 5.24% 6.97% 1926-50 4.82% 3.45% 1951-75 3.05% 6.04% 1976-80 2.70% 10.87% 1981-85 18.96% 14.17% 1986 19.85% 8.19% 1987 -0.27% 9.64% Standard & Poor's 500 Composite Stock Index returns: 1926-87 12.01% 20.55% 1926-50 10.90% 27.18% 1951-75 11.87% 13.57% 1976-80 14.81% 14.60% 1981-85 15.49% 13.92% 1986 18.47% 17.94% 1987 5.23% 30.50%Exhibit 5 Spreads between S&P 500 Composite Returns and Bond Rates Arithmetic Standard Years Average Deviation Spread between S&P 500 Composite returns and short-term US. Treasury bill returns: 1 926-87 8.47% 20.60% 1926-50 9.89% 27.18% 1951-75 8.20% 13.71% 1976-80 7.01% 14.60% 1981-85 5.17% 14.15% 1986 12.31% 17.92% 1987 -0.23% 30.61% Spread between S&P 500 Composite returns and long-term U.S. government bond returns: 1 926-87 7.43% 20.78% 1926-50 6.76% 26.94% 1951 -75 9.48% 14.35% 1976-80 12.86% 15.58% 1981 -85 -2.36% 13.70% 1986 -5.97% 14.76% 1987 7.92% 35.35% Spread between S&P 500 Composite returns and long-term, nigh-grade corporate bonds: 1 926-87 6.77% 20.31% 1926-50 6.06% 26.70% 1951 -75 8.82% 13.15% 1976-80 12.11% 15.84% 1981-85 -3.47% 13.59% 1986 -1 .38% 14.72% 1987 5.50% 34.06% Source: Casewriter estimates based on data from the University of Chicago's Center for Research in Security Prices
Step by Step Solution
There are 3 Steps involved in it

Get step-by-step solutions from verified subject matter experts