Answered step by step
Verified Expert Solution
Link Copied!

Question

1 Approved Answer

This is for my course review. Not sure exactly how to read these charts...How to I find margin of error? Course F 10 %06 II

This is for my course review. Not sure exactly how to read these charts...How to I find margin of error?
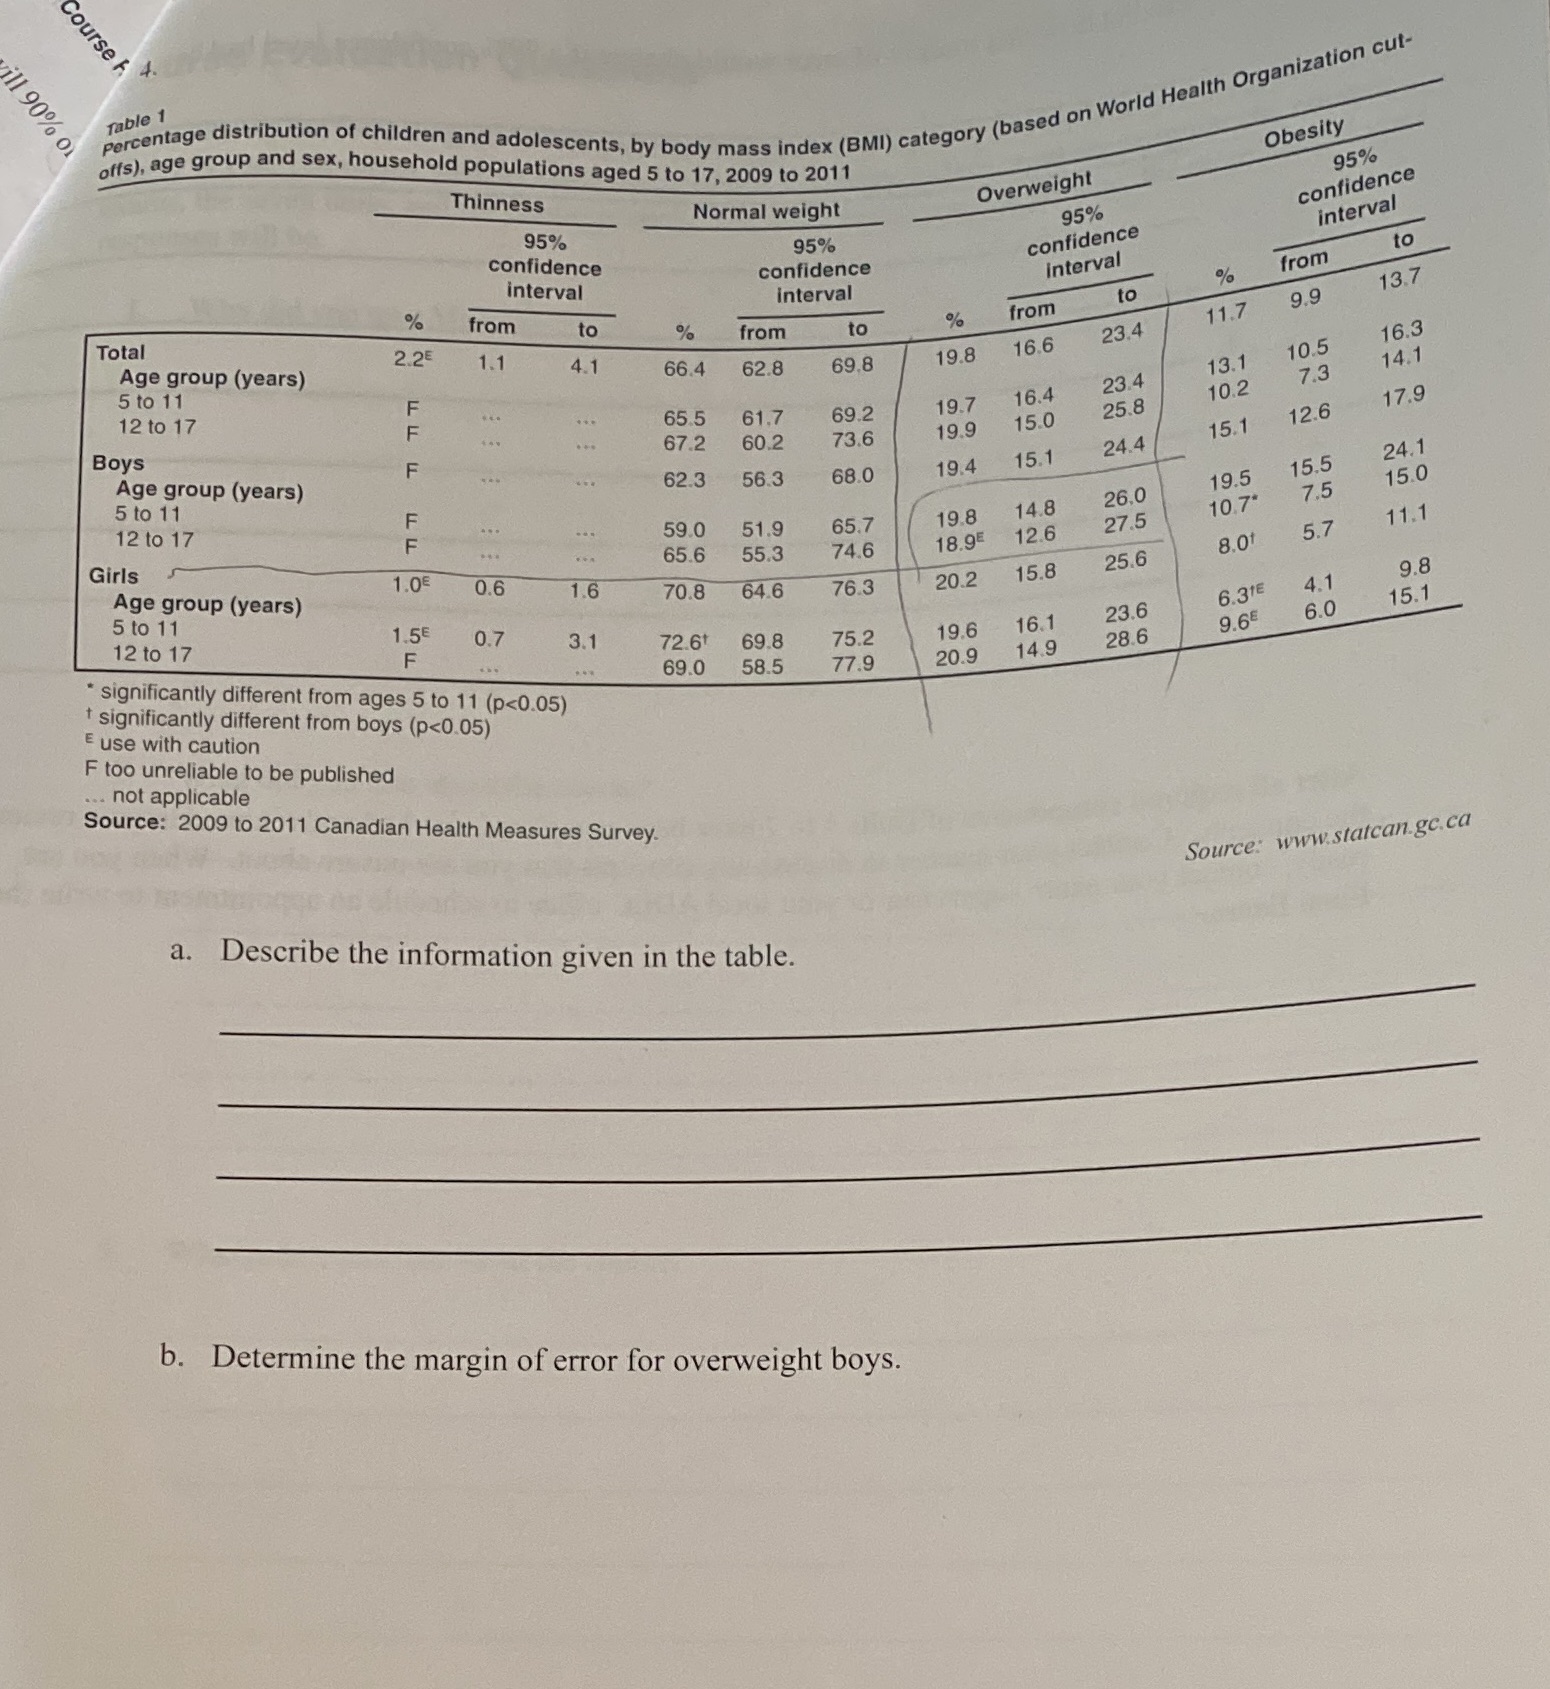
image text in transcribed
Course F 10 %06 II fable stage distribution of chinaten and adolescents, by body mass index (BMI) category (based on World Health Organization cut- offs), age group and sex, household populations aged 5 to 17, 2009 to 2011 Obesity Thinness 95% Normal weight Overweight confidence 95% 95% interval confidence 95% confidence interval confidence Interval to interval % from % from to 13.7 Total to 2.2 % from to % from 11.7 9.9 Age group (years) 1.1 4.1 23.4 5 to 11 66.4 62.8 69.8 9.8 16.6 16.3 13.1 10.5 12 to 17 F 14.1 23.4 73 F . .. 65.5 61.7 19.7 16.4 10.2 Boys 69.2 67.2 60.2 73.6 19.9 15.0 25.8 17.9 12. Age group (years) 15.1 24.4 15.1 5 to 11 32.3 56.3 68.0 194 24.1 15.5 12 to 17 F 19.5 150 F 7.5 . . 59.0 26.0 51.9 65.7 14.8 Girls 19.8 10.7* 65.6 55 3 27.5 74.6 18.9 2.6 5.7 11.1 1.0E 0.6 8.0 Age group (years) 1.6 70.8 64.6 15.8 25.6 5 to 11 76.3 20.2 9.8 12 to 17 1.5 0.7 6.31 4.1 3.1 72.6 16.1 23.6 6.0 15.1 F 69.8 75.2 9.6 69.0 28.6 9.6E 58.5 14.9 * significantly different from ages 5 to 11 (p

Step by Step Solution

There are 3 Steps involved in it

Step: 1

blur-text-image

Get Instant Access to Expert-Tailored Solutions

See step-by-step solutions with expert insights and AI powered tools for academic success

Step: 2

blur-text-image

Step: 3

blur-text-image

Ace Your Homework with AI

Get the answers you need in no time with our AI-driven, step-by-step assistance

Get Started

Recommended Textbook for

Practical Linear Algebra A Geometry Toolbox

Authors: Gerald Farin, Dianne Hansford

4th Edition

1003051219, 9781003051213

More Books

Students also viewed these Mathematics questions

Question

How We Listen?

Answered: 1 week ago