This is for statistics in psychology
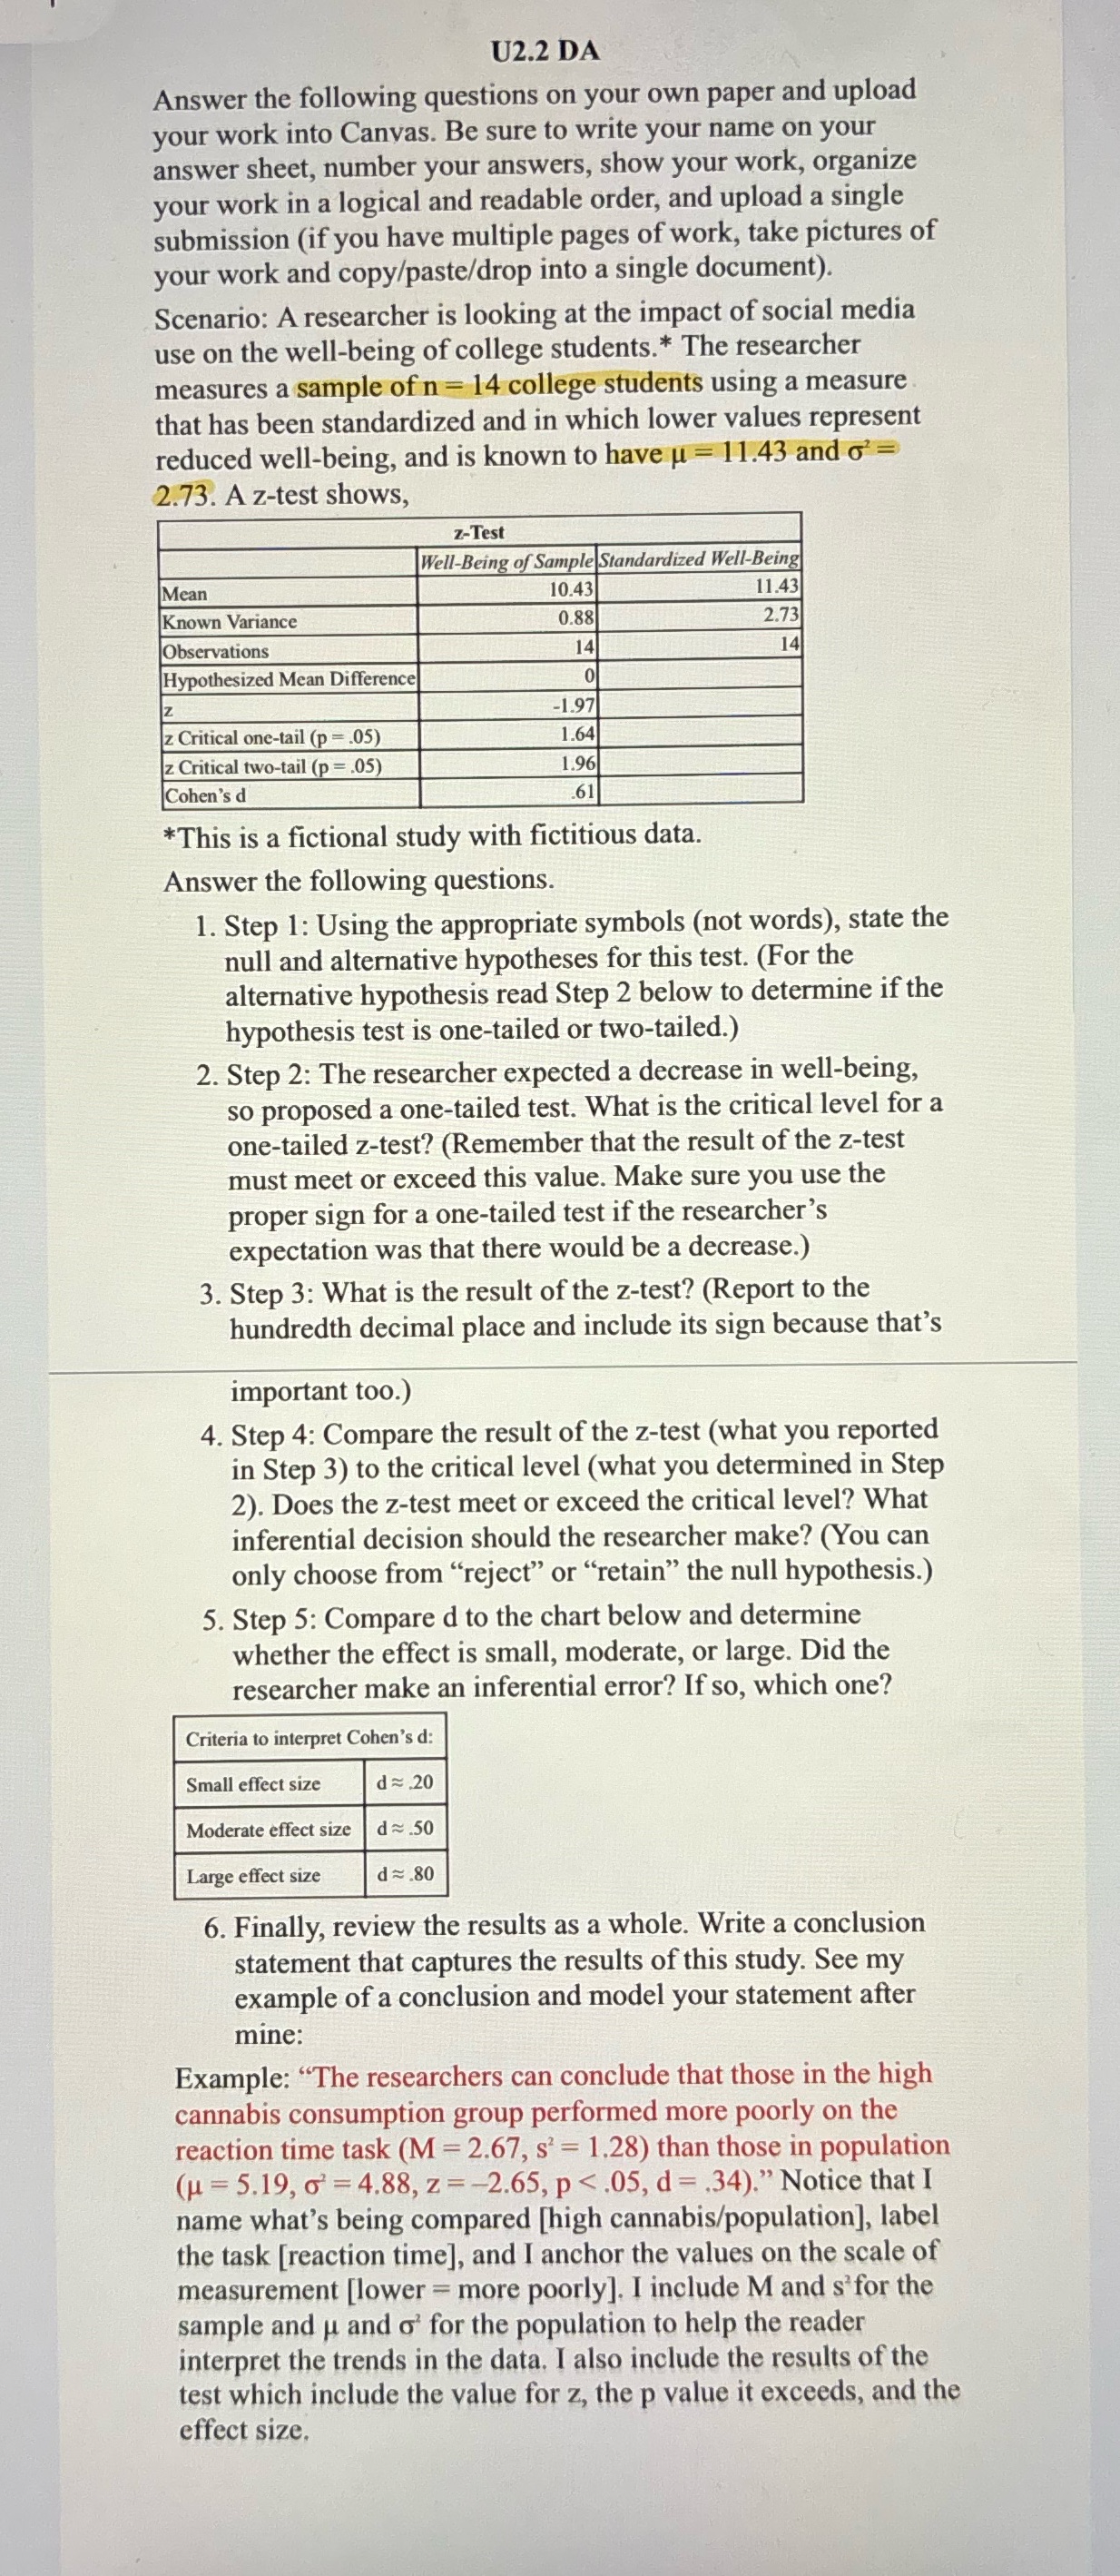
U2.2 DA Answer the following questions on your own paper and upload your work into Canvas. Be sure to write your name on your answer sheet, number your answers, show your work, organize your work in a logical and readable order, and upload a single submission (if you have multiple pages of work, take pictures of your work and copy/paste/drop into a single document). Scenario: A researcher is looking at the impact of social media use on the well-being of college students.* The rescarcher measures a sample of n= 14 college students using a measure that has been standardized and in which lower values represent reduced well-being, and is known to have = 11.43 and 6" = 2.73. A z-test shows, *This is a fictional study with fictitious data. Answer the following questions. 1. Step 1: Using the appropriate symbols (not words), state the null and alternative hypotheses for this test. (For the alternative hypothesis read Step 2 below to determine if the hypothesis test is one-tailed or two-tailed.) 2. Step 2: The researcher expected a decrease in well-being, so proposed a one-tailed test. What is the critical level fora one-tailed z-test? (Remember that the result of the z-test must meet or exceed this value. Make sure you use the proper sign for a one-tailed test if the researcher's expectation was that there would be a decrease.) 3. Step 3: What is the result of the z-test? (Report to the hundredth decimal place and include its sign because that's important t00.) 4. Step 4: Compare the result of the z-test (what you reported in Step 3) to the critical level (what you determined in Step 2). Does the z-test meet or exceed the critical level? What inferential decision should the researcher make? (You can only choose from \"reject\" or \"retain\" the null hypothesis.) 5. Step 5: Compare d to the chart below and determine whether the effect is small, moderate, or large. Did the researcher make an inferential error? If so, which one? Criteria to interpret Cohen's d: Small effect size Moderate effect size m Large cffect size 6. Finally, review the results as a whole. Write a conclusion statement that captures the results of this study. See my example of a conclusion and model your statement after mine: Example: \"The researchers can conclude that those in the high cannabis consumption group performed more poorly on the reaction time task (M = 2.67, s = 1.28) than those in population (1=5.19,0' =4.88, z=-2.65, p


