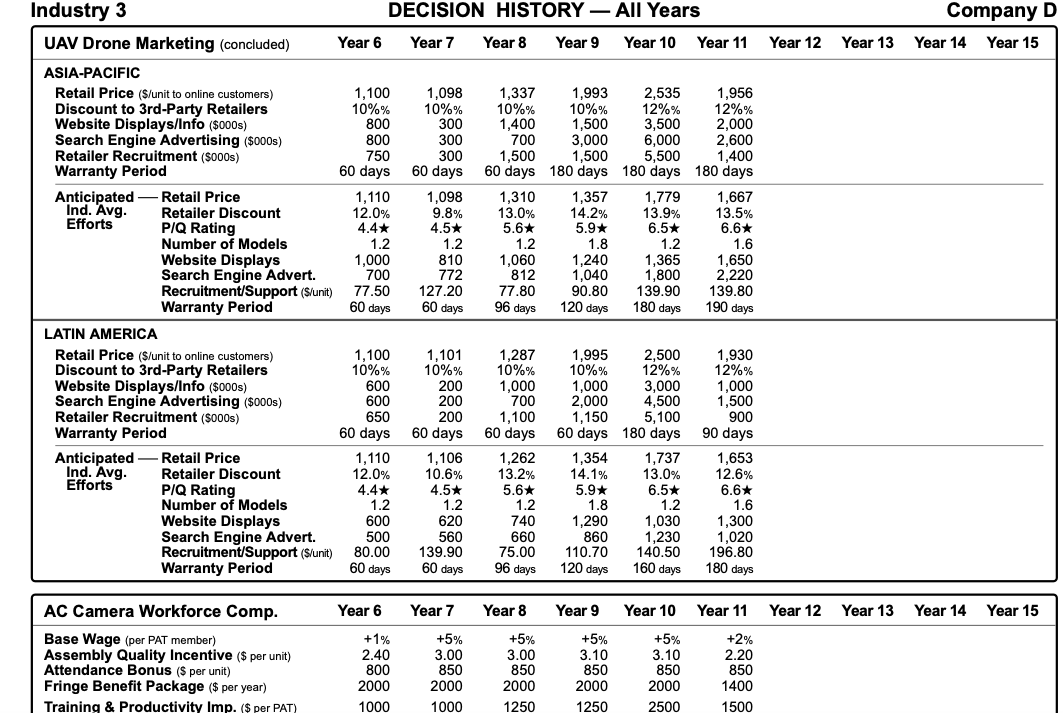
This is Glo-Bus Simulation and I have to prepare a 3 year strategic plan for years 9-11. I need help.
Doing a 3-year strategic plan involves:
- Stating a strategic vision for your company.
- Establishing objectives for EPS, ROE, credit rating, image rating, and stock price appreciation each of the next three years.
- Declaring what competitive strategy your company intends to pursue.
- Preparing a pro forma income statement for the each of the next three years based on your projections of unit sales, revenues, costs, and profits in each of the four geographic regions during each year of the plan period.
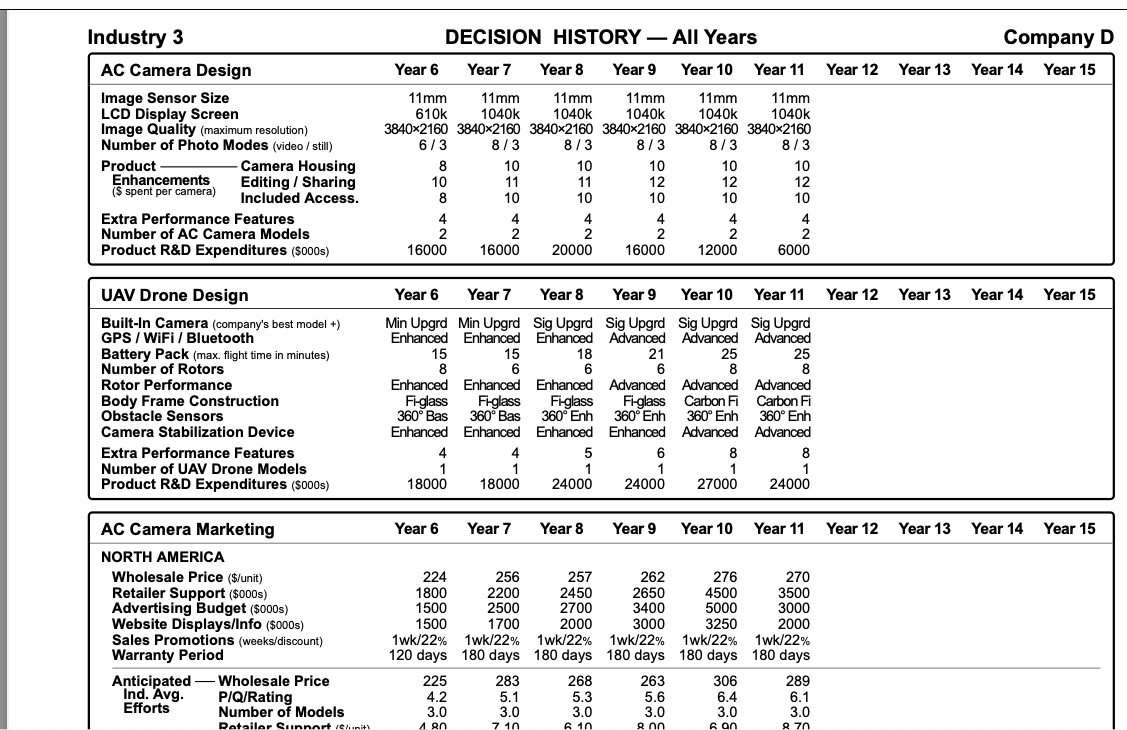
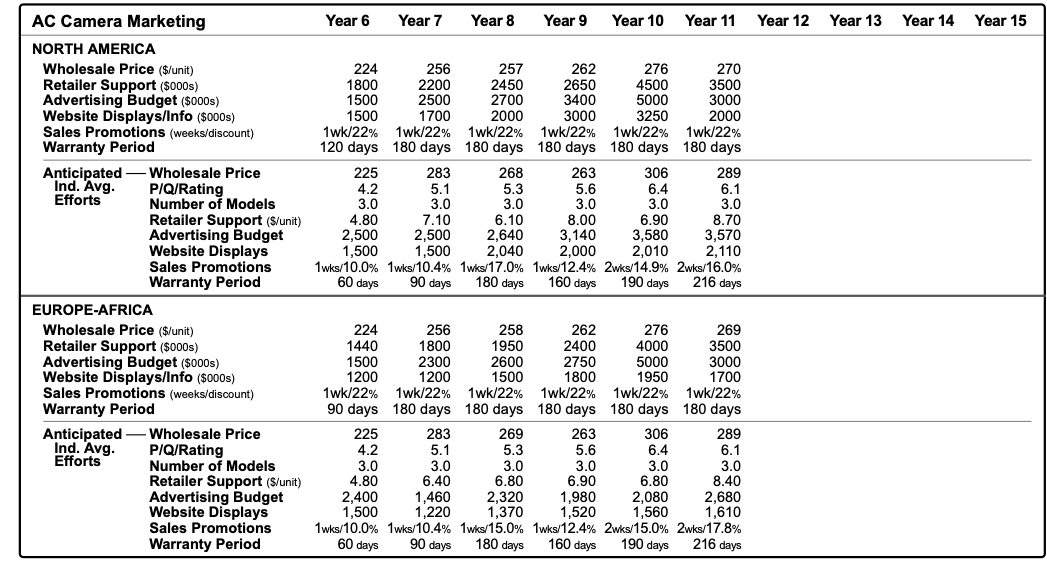
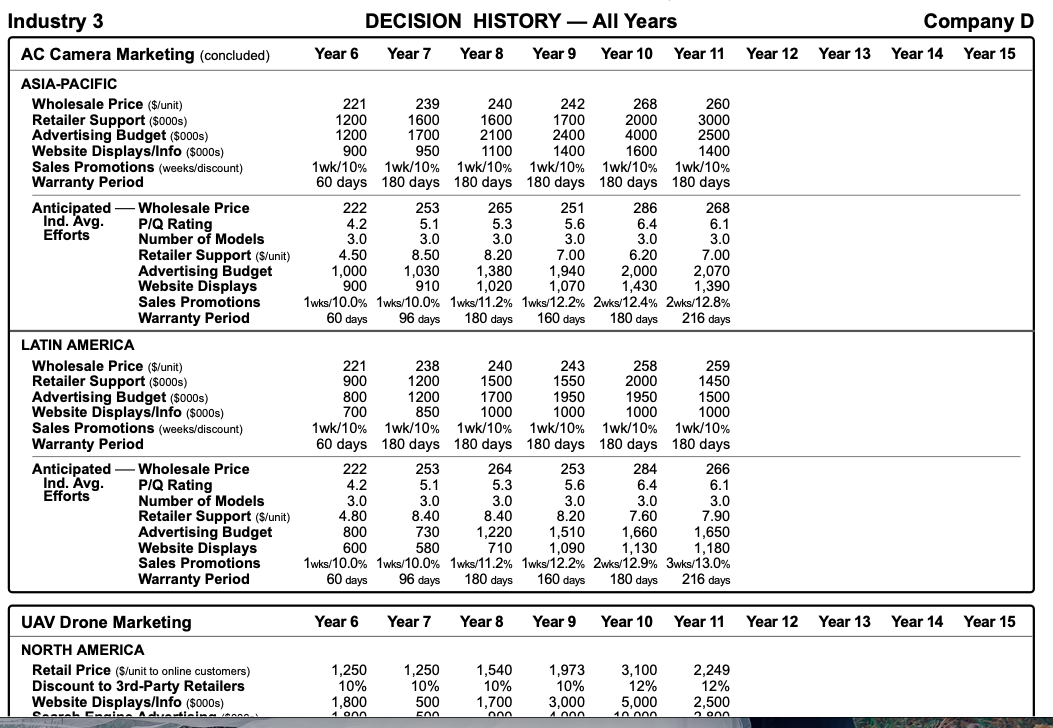
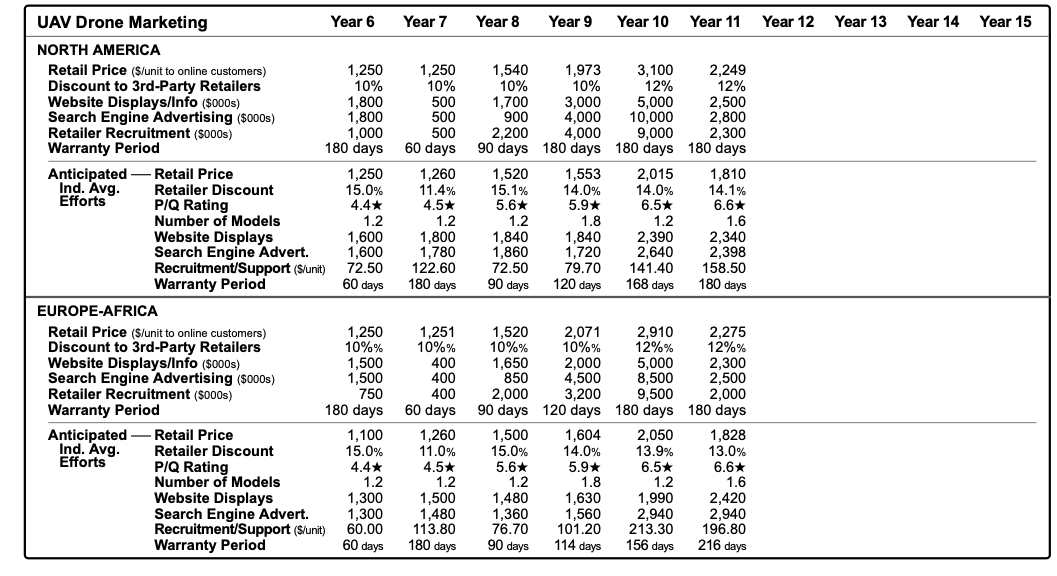
DECISION HISTORY All Years Company D Year 13 Year 14 Year 15 Industry 3 AC Camera Design Image Sensor Size LCD Display Screen Image Quality (maximum resolution) Number of Photo Modes (video / still) Product Camera Housing Enhancements Editing / Sharing (s spent per camera) Included Access. Extra Performance Features Number of AC Camera Models Product R&D Expenditures (5000s) Year 6 Year 7 Year 8 Year 9 Year 10 Year 11 Year 12 11mm 11mm 11mm 11mm 11mm 11mm 610k 1040k 1040k 1040K 1040k 1040k 3840x2160 3840x2160 3840x2160 3840x2160 3840x2160 3840x2160 6/3 8/3 8/3 8/3 8/3 8/3 8 10 10 10 10 10 10 11 11 12 12 12 8 10 10 10 10 10 4 4 4 4 4 4 2 2 2 2 2 2 16000 16000 20000 16000 12000 6000 Year 13 Year 14 Year 15 25 25 UAV Drone Design Built-In Camera (company's best model +) GPS / WiFi / Bluetooth Battery Pack (max. flight time in minutes) Number of Rotors Rotor Performance Body Frame Construction Obstacle Sensors Camera Stabilization Device Extra Performance Features Number of UAV Drone Models Product R&D Expenditures (5000s) Year 6 Year 7 7 Year 8 Year 9 Year 10 Year 11 Year 12 Min Upgrd Min Upgrd Sig Upgrd Sig Upgrd Sig Upgrd Sig Upgrd Enhanced Enhanced Enhanced Advanced Advanced Advanced 15 15 18 21 8 6 6 6 8 8 8 Enhanced Enhanced Enhanced Advanced Advanced Advanced Figlass Figlass Figlass Fi-glass Carbon Fi Carbon Fi 360 Bas 360 Bas 360 Enh 360 Enh 360 Enh 360 Enh Enhanced Enhanced Enhanced Enhanced Advanced Advanced 4 4 5 6 8 8 1 1 1 1 1 1 18000 18000 24000 24000 27000 24000 Year 6 Year 7 Year 8 8 Year 9 Year 10 Year 11 Year 12 Year 13 Year 14 Year 15 AC Camera Marketing NORTH AMERICA Wholesale Price ($/unit) Retailer Support ($000s) Advertising Budget ($000s) Website Displays/Info ($000s) Sales Promotions (weeks/discount) Warranty Period Anticipated Wholesale Price Ind. Avg. P/Q/Rating Efforts Number of Models Retailer Sunnart e mit 224 256 257 262 276 270 1800 2200 2450 2650 4500 3500 1500 2500 2700 3400 5000 3000 1500 1700 2000 3000 3250 2000 1wk/22% 1wk/22% 1wk/22% 1wk/22% 1wk/22% 1wk/22% / 120 days 180 days 180 days 180 days 180 days 180 days 225 283 268 263 306 289 4.2 5.1 5.3 5.6 6.4 6.1 3.0 3.0 3.0 3.0 3.0 3.0 A 710 610 enn han 70 Year 6 Year 7 Year 8 Year 9 Year 10 Year 11 Year 12 Year Year 14 Year 15 AC Camera Marketing NORTH AMERICA Wholesale Price ($/unit) Retailer Support ($000s) Advertising Budget ($000s) Website Displays/Info ($000s) Sales Promotions (weeks/discount) Warranty Period Anticipated Wholesale Price Ind. Avg. P/Q/Rating Efforts Number of Models Retailer Support ($/unit) Advertising Budget Website Displays Sales Promotions Warranty Period EUROPE-AFRICA Wholesale Price ($/unit) Retailer Support ($000s) Advertising Budget ($000s) Website Displays/Info ($000s) Sales Promotions (weeks/discount) Warranty Period Anticipated Wholesale Price Ind. Avg. P/Q/Rating Efforts Number of Models Retailer Support (S/unit) Advertising Budget Website Displays Sales Promotions Warranty Period 224 256 257 262 276 270 1800 2200 2450 2650 4500 3500 1500 2500 2700 3400 5000 3000 1500 1700 2000 3000 3250 2000 1wk/22% 1wk/22% 1wk/22% 1wk/22% 1wk/22% 1wk/22% 120 days 180 days 180 days 180 days 180 days 180 days 225 283 268 263 306 289 4.2 5.1 5.3 5.6 6.4 6.1 3.0 3.0 3.0 3.0 3.0 3.0 4.80 7.10 6.10 8.00 6.90 8.70 2,500 2,500 2,640 3,140 3,580 3,570 1,500 2,040 2,000 2,010 2,110 1wks/10.0% 1wks/10.4% 1wks/17.0% 1wks/12.4% 2wks/14.9% 2wks/16.0% 90 days 180 days 160 days 190 days 1,500 60 days 216 days 1950 224 256 258 262 276 269 1440 1800 2400 4000 3500 1500 2300 2600 2750 5000 3000 1200 1200 1500 1800 1950 1700 1wk/22% 1wk/22% 1wk/22% 1wk/22% 1wk/22% 1wk/22% 90 days 180 days 180 days 180 days 180 days 180 days 225 283 269 263 306 289 4.2 5.1 5.3 5.6 6.4 6.1 3.0 3.0 3.0 3.0 3.0 3.0 4.80 6.40 6.80 6.90 6.80 8.40 2,400 1,460 2,320 1,980 2,080 2.680 1,500 1,220 1,370 1,520 1,560 1,610 1wks/10.0% 1wks/10.4% 1wks/15.0% 1wks/12.4% 2wks/15.0% 2wks/17.8% 60 days 90 days 180 days 160 days 190 days 216 days DECISION HISTORY All Years Industry 3 AC Camera Marketing (concluded) Company D Year 14 Year 15 Year 6 Year 7 Year 8 Year 9 Year 10 Year 11 Year 12 Year 13 221 239 240 242 268 260 1200 1600 1600 1700 2000 3000 1200 1700 2100 2400 4000 2500 900 950 1100 1400 1600 1400 1wk/10% 1wk/10% 1wk/10% 1wk/10% 1wk/10% 1wk/10% 60 days 180 days 180 days 180 days 180 days 180 days 222 253 265 251 286 268 4.2 5.1 5.3 5.6 6.4 6.1 3.0 3.0 3.0 3.0 3.0 3.0 4.50 8.50 8.20 7.00 6.20 7.00 1,000 1,030 1,380 1,940 2,000 2,070 900 910 1,020 1,070 1,430 1,390 1wks/10.0% 1wks/10.0% 1wks/11.2% 1wks/12.2% 2wks/12.4% 2wks/12.8% 60 days 96 days 180 days 160 days 180 days 216 days ASIA-PACIFIC Wholesale Price ($/unit) Retailer Support ($000s) Advertising Budget ($000s) Website Displays/Info ($000s) Sales Promotions (weeks/discount) Warranty Period Anticipated Wholesale Price Ind. Avg. PIQ Rating Efforts Number of Models Retailer Support ($/unit) Advertising Budget Website Displays Sales Promotions Warranty Period LATIN AMERICA Wholesale Price ($/unit) Retailer Support ($000s) Advertising Budget ($000s) Website Displays/Info ($000s) Sales Promotions (weeks/discount) Warranty Period Anticipated Wholesale Price Ind. Avg. P/Q Rating Efforts Number of Models Retailer Support (/unit) Advertising Budget Website Displays Sales Promotions Warranty Period 221 238 240 243 258 259 900 1200 1500 1550 2000 1450 800 1200 1700 1950 1950 1500 700 850 1000 1000 1000 1000 1 wk/10% 1wk/10% 1wk/10% 1wk/10% 1wk/10% 1wk/10% 60 days 180 days 180 days 180 days 180 days 180 days 222 253 264 253 284 266 4.2 5.1 5.3 5.6 6.4 6.1 3.0 3.0 3.0 3.0 3.0 3.0 4.80 8.40 8.40 8.20 7.60 7.90 800 730 1,220 1,510 1,660 1,650 600 580 710 1,130 1,180 1wks/10.0% 1wks/10.0% 1wks/11.2% 1wks/12.2% 2wks/12.9% 3wks/13.0% 60 days 96 days 180 days 216 days 1,090 160 days 180 days Year 6 Year 7 Year 8 Year 9 Year 10 Year 11 Year 12 Year 13 Year 14 Year 15 UAV Drone Marketing NORTH AMERICA Retail Price ($/unit to online customers) Discount to 3rd-Party Retailers Website Displays/Info ($000s) Cal Canin Adminishon 1,250 10% 1,800 1 onn 1.250 10% 500 con 1,540 10% 1,700 nnn 1,973 10% 3,000 Annn 3,100 12% 5,000 2,249 12% 2,500 Donn Year 7 Year 8 Year 9 Year 10 Year 11 Year 12 Year 13 Year 14 Year 15 1,250 10% 500 500 500 60 days UAV Drone Marketing Year 6 NORTH AMERICA Retail Price (s/unit to online customers) 1,250 Discount to 3rd-Party Retailers 10% Website Displays/Info ($000s) 1,800 Search Engine Advertising ($000s) 1,800 Retailer Recruitment (5000s) 1,000 Warranty Period 180 days Anticipated Retail Price 1,250 Ind. Avg. Retailer Discount 15.0% Efforts PIQ Rating 4.4* Number of Models 1.2 Website Displays 1,600 Search Engine Advert. 1,600 Recruitment/Support ($/unit) 72.50 Warranty Period 60 days EUROPE-AFRICA Retail Price ($/unit to online customers) 1,250 Discount to 3rd-Party Retailers 10%% Website Displays/Info ($000s) 1,500 Search Engine Advertising ($000s) 1,500 Retailer Recruitment ($000s) 750 Warranty Period 180 days Anticipated Retail Price 1,100 Ind. Avg. Retailer Discount 15.0% Effort PIQ Rating 4.4* Number of Models 1.2 Website Displays 1,300 Search Engine Advert. 1,300 Recruitment/Support (S/unit) 60.00 Warranty Period 60 days 1,260 11.4% 4.5* 1.2 1.800 1,780 122.60 180 days 1,540 1,973 3,100 2,249 10% 10% 12% 12% 1,700 3,000 5,000 2,500 900 4,000 10,000 2,800 2,200 4,000 9,000 2,300 90 days 180 days 180 days 180 days 1,520 1,553 2,015 1,810 15.1% 14.0% 14.0% 14.1% 5.6* 5.9* 6.5* 6.6* 1.2 1.8 1.2 1.6 1,840 1,840 2,390 2,340 1,860 1,720 2,640 2,398 72.50 79.70 141.40 158.50 90 days 168 days 180 days 120 days 1.251 10%% 400 400 400 60 days 1,260 11.0% 4.5* 1.2 1,500 1,480 113.80 1,520 2,071 2,910 2,275 10%% 10%% 12%% 12%% 1,650 2,000 5,000 2,300 850 4,500 8,500 2,500 2,000 3,200 9,500 2,000 90 days 120 days 180 days 180 days 1,500 1,604 2,050 1,828 15.0% 14.0% 13.9% 13.0% 5.6* 5.9* 6.5* 6.6* 1.2 1.8 1.2 1.6 1,480 1,630 1,990 2,420 1,360 1,560 2,940 2,940 76.70 101.20 213.30 196.80 90 days 114 days 180 days 156 days 216 days Company D Year 12 Year 13 Year 14 Year 15 Industry 3 DECISION HISTORY All Years UAV Drone Marketing (concluded) Year 6 Year 7 Year 8 Year 9 Year 10 Year 11 ASIA-PACIFIC Retail Price ($/unit to online customers) 1,100 1,098 1,337 1,993 2,535 1,956 Discount to 3rd-Party Retailers 10%% 10%% 10%% 10%% 12%% 12%% Website Displays/Info ($000s) 800 300 1,400 1,500 3,500 2,000 Search Engine Advertising ($000s) 800 300 700 3,000 6,000 2,600 Retailer Recruitment ($000s) 750 300 1,500 1,500 5,500 1,400 Warranty Period 60 days 60 days 60 days 180 days 180 days 180 days Anticipated Retail Price 1,110 1,098 1,310 1,357 1,779 1,667 Ind. Avg. Retailer Discount 12.0% 9.8% 13.0% 14.2% 13.9% 13.5% Efforts PIQ Rating 4.4* 4.5* 5.6* 5.9* 6.5* 6.6* Number of Models 1.2 1.2 1.2 1.8 1.2 1.6 Website Displays 1,000 810 1,060 1,240 1,365 1,650 Search Engine Advert. 700 772 812 1,040 1,800 2,220 Recruitment/Support ($/unit) 77.50 127.20 77.80 90.80 139.90 139.80 Warranty Period 60 days 60 days 96 days 180 days 190 days LATIN AMERICA Retail Price ($/unit to online customers) 1,100 1,101 1,287 1,995 2,500 1,930 Discount to 3rd-Party Retailers 10%% 10%% 10%% 10%% 12%% 12%% Website Displays/Info ($000s) 600 200 1,000 1,000 3,000 Search Engine Advertising ($000s) 600 200 700 2,000 4,500 1,500 Retailer Recruitment (5000s) 650 200 1,150 5,100 900 Warranty Period 60 days 180 days Anticipated Retail Price 1,110 1,106 1,262 1,354 1,737 1,653 Ind. Avg. Retailer Discount 12.0% 10.6% 13.2% 14.1% 13.0% Efforts 12.6% PIQ Rating 4.4* 4.5* 5.6* 5.9* 6.5* 6.6* Number of Models 1.2 1.2 1.2 1.8 1.2 1.6 Website Displays 600 620 740 1,290 1,030 1,300 Search Engine Advert. 500 560 660 860 1,230 1,020 Recruitment/Support (S/unit) 80.00 139.90 75.00 110.70 140.50 196.80 Warranty Period 60 days 60 days 96 days 120 days 160 days 180 days 120 days 1,000 1,100 60 days 60 days 60 days 90 days Year 6 Year 7 Year 8 Year 9 Year 10 Year 11 Year 12 Year 13 Year 14 Year 15 AC Camera Workforce Comp. Base Wage (per PAT member) Assembly Quality Incentive ($ per unit) Attendance Bonus (S per unit) Fringe Benefit Package ($ per year) Training & Productivity Imp. ($ per PAT) +1% 2.40 800 2000 1000 +5% 3.00 850 2000 1000 +5% 3.00 850 2000 1250 +5% 3.10 850 2000 1250 +5% 3.10 850 +2% 2.20 850 1400 1500 2000 2500 Year 6 Year 7 Year 8 Year 9 Year 10 Year 11 Year 12 Year 13 Year 14 Year 15 AC Camera Workforce Comp. Base Wage (per PAT member) Assembly Quality Incentive ($ per unit) Attendance Bonus ($ per unit) Fringe Benefit Package ($ per year) Training & Productivity Imp. ($ per PAT) +1% 2.40 800 2000 1000 +5% 3.00 850 2000 1000 +5% 3.00 850 2000 1250 +5% 3.10 850 2000 1250 +5% 3.10 850 2000 2500 +2% 2.20 850 1400 1500 Year 6 Year 7 Year 8 Year 9 Year 10 Year 11 Year 12 Year 13 Year 14 Year 15 +5% 5.00 UAV Drone Workforce Comp. Base Wage (per PAT member) Assembly Quality Incentive ($ per unit) Attendance Bonus ($ per unit) Fringe Benefit Package ($ per year) Training & Productivity Imp. ($ per PAT) +1% 4.80 800 2000 2000 +5% 5.00 850 2200 2750 850 +5% 5.00 850 2200 2750 +5% 5.00 850 2200 3000 +2% 6.00 850 2400 2000 2200 2750 Year 6 Year 7 Year 8 Year 9 Year 10 Year 11 Year 12 Year 13 Year 14 Year 15 0 0 AC Camera Assembly Facility Facility Expansion (new spaces added) Newly Installed Workstations Robotics Upgrade (for all workstations) 30 20 No Upg 60 30 No Upg 100 60 Init Upg Init Upg Init Upg Init Upg Year 6 Year 7 Year 8 Year 9 Year 10 Year 11 Year 12 Year 13 Year 14 Year 15 UAV Drone Assembly Facility Facility Expansion (new spaces added) Newly Installed Workstations Robotics Upgrade (for all workstations) 0 20 10 No Upg 150 20 No Upg 8 Init Upg 0 0 20 Ini Search documents and file names for text No Upg - DECISION HISTORY All Years Company D Year 6 Year 7 Year 8 Year 9 Year 10 Year 11 Year 12 Year 13 Year 14 Year 15 0% No 0% No 0% No 11% Yes 40% Yes 40% Yes Industry 3 Special AC Camera Contracts NORTH AMERICA Discount Offer (% off of standard price) Include Projected Outcomes in Y6 EUROPE-AFRICA Discount Offer (% off of standard price) Include Projected Outcomes in Y6 ASIA-PACIFIC Discount Offer (% off of standard price) Include Projected Outcomes in Y6 0% No 0% No 0% No 11% Yes 40% Yes 40% Yes 0% No 0% 0% No 11% Yes 40% Yes No 40% Yes LATIN AMERICA Discount Offer (% off of standard price) Include Projected Outcomes in Y6 0% No 0% No 0% No 11% Yes 40% Yes 11% Yes Year 6 Year 7 Year 8 Year 9 Year 14 Year 15 Corporate Social Responsibility Charitable Contributions - Dollars (000s) % of Profit Green Initaitives (environmental sustainability) Renewable Energy Program ($000s) Improved Working - Cafeteria/Child Care Conditions Saftey Equipment Supplier Code of Conduct / Monitoring 0 0.0% No 0 Yes Yes Yes 0 0.0% No 1000 Yes Yes Yes 0 0.0% No 1000 Yes Yes Yes 0 0.0% No 2500 Yes Yes Yes Year 10 Year 11 Year 12 Year 13 0 0 0.0% 0.0% Yes Yes 2500 2500 Yes Yes Yes Yes Search documents and file names for text Finance and Cash Flow Year 6 Year 7 Year 8 Year 9 Year 10 Year 11 Year 12 Year 13 Year 14 Year 15 0 SOURCES OF ADDITIONAL CASH 1-Year Bank Loan ($000s) 5-Year Bank Loan ($000s) 10-Year Bank Loan ($000s) Stock Issue (000s of shares) OOOO USES FOR EXCESS CASH Early Repayment of Loan # Bank Loans Loan # Dividend por obor) oo oos 0 0 non ; oo Boo Soo non nnn ?nn 30 31n Year 6 Year 7 Year 8 Year 9 Year 10 Year 11 Year 12 Year 13 Year 14 Year 15 Finance and Cash Flow SOURCES OF ADDITIONAL CASH 1-Year Bank Loan ($000s) 5-Year Bank Loan ($000s) 10-Year Bank Loan ($000s) Stock Issue (000s of shares) OOO 0 0 0 0 0 USES FOR EXCESS CASH Early Repayment of Loan # Bank Loans Loan # Dividend ($ per share) Stock Repurchases (000s of shares) Boo OO 0 0 0.00 0 0.00 0.00 0 2.00 0 0 3.00 0 3.10 0 0 0 Year 6 Year 7 Year 8 Year 9 Year 10 Year 11 Year 12 Year 13 Year 14 Year 15 428,923 596,636 560,452 663,317 1,111,715 694,896 37,838 88,749 61,671 97,905 254,994 105,911 1.89 4.44 3.08 4.90 12.75 5.30 28.4% 45.0% 25.6% 32.5% 61.0% 29.0% A- A- A- A A 87 77 77 89 77 79 Projected vs. Actual Performance PERFORMANCE PROJECTIONS Net Revenues ($000s) Net Profit ($000s) Earnings Per share (EPS) Return On Equity (ROE) Credit Rating Image Rating ACTUAL PERFORMANCE Net Revenues ($000s) Net Profit ($000s) Earnings Per share (EPS) Return On Equity (ROE) Credit Rating Image Rating AVERAGE VARIANCE 427,887 480,467 561,955 631,984 38,450 56,657 62,565 88,631 1.92 2.83 3.13 4.43 28.7% 31.2% 26.0% 29.9% A- A- A 81 78 77 78 1.3% -26.6% 1.0% -6.1% 674,527 82,476 4.12 24.8% A- 75 A- A- A- -49.9%