

Answered step by step
Verified Expert Solution
Question
1 Approved Answer
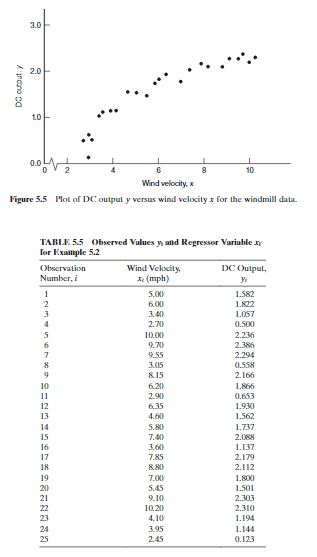
This is Linear Regression Analysis (Montgomery, Peck, vining) I need someone to explaine this to me. This is example in the book Ch. 5. We
This is Linear Regression Analysis (Montgomery, Peck, vining)
I need someone to explaine this to me. This is example in the book Ch. 5. We also use JMP program.

Step by Step Solution
There are 3 Steps involved in it
Step: 1

Get Instant Access to Expert-Tailored Solutions
See step-by-step solutions with expert insights and AI powered tools for academic success
Step: 2

Step: 3
Ace Your Homework with AI
Get the answers you need in no time with our AI-driven, step-by-step assistance
Get Started
Precalculus Enhanced With Graphing Utilities (Subscription)
Authors: Michael Sullivan, Michael Sullivan III
7th Edition
0134273125, 9780134273129