

Answered step by step
Verified Expert Solution
Question
1 Approved Answer
This is MATLAB coding, plotting figure problem. What goes into the blank '[TO COMPLETE #1]'? We shall create a figure showing a linear regression. The
This is MATLAB coding, plotting figure problem.
What goes into the blank '[TO COMPLETE #1]'?
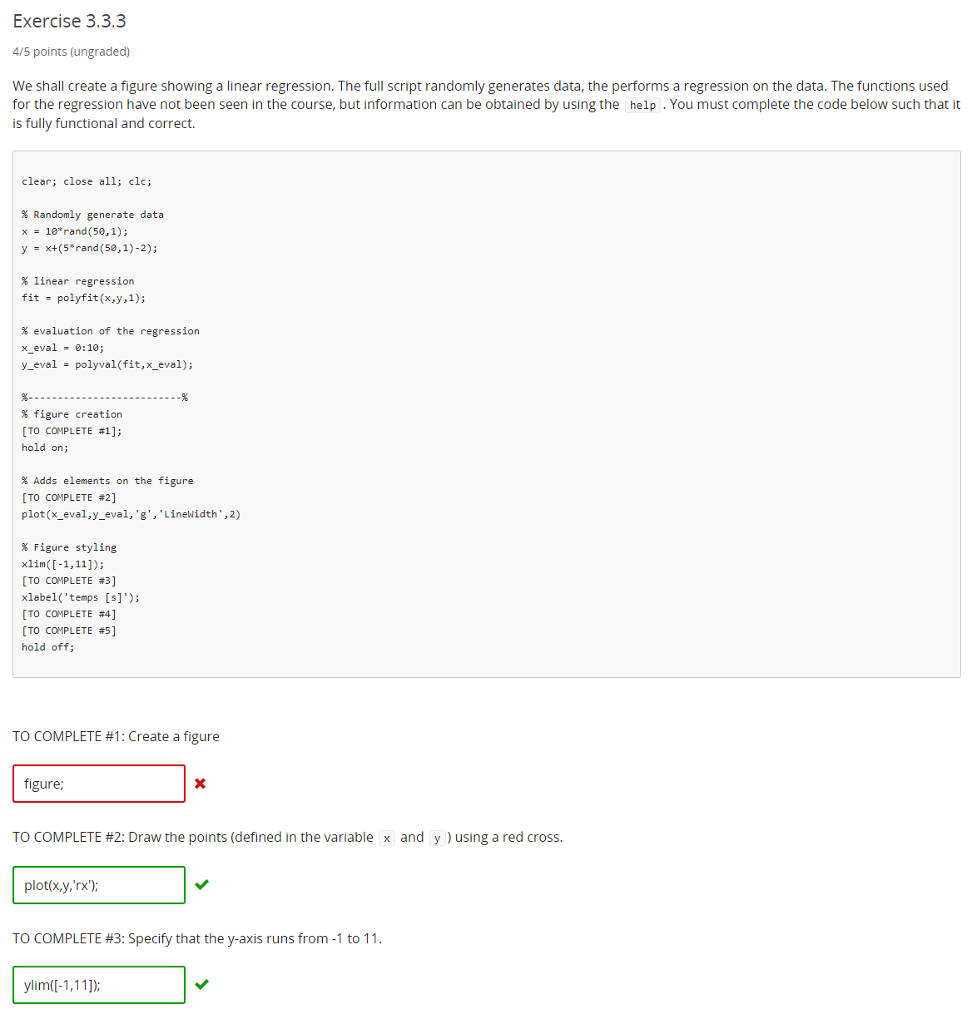
We shall create a figure showing a linear regression. The full script randomly generates data, the performs a regression on the data. The functions used for the regression have not been seen in the course, but information can be obtained by using the help. You must complete the code below such that it is fully functional and correct. clear: close all: clc: % Randomly generate data x = 10*rand(50, l1): y = x + (5*rand (50, 1) - 2): % linear regression fit = polyfit(x, y, 1): % evaluation of the regression x_eval = 0: 10: y_eval = polyval(fit, x_eval): %..........................% % figure creation [TO COMPLETE #1]: hold on: % Adds elements on the figure [TO COMPLETE #2] plot(x_eval, y_eval, 'g', 'LineWidth', 2) % Figure styling xlim([-1, 11]): [TO COMPLETE #3] xlabel('temps [s]'): [TO COMPLETE #4] [TO COMPLETE #5] hold off: TO COMPLETE #1: Create a figure TO COMPLETE #2: Draw the points (defined in the variable x and y) using a red cross. plot(x, y, 'rx'): TO COMPLETE #3: Specify that the y-axis runs from -1 to 11. ylim([-1, 11])
Step by Step Solution
There are 3 Steps involved in it
Step: 1

Get Instant Access to Expert-Tailored Solutions
See step-by-step solutions with expert insights and AI powered tools for academic success
Step: 2

Step: 3
Ace Your Homework with AI
Get the answers you need in no time with our AI-driven, step-by-step assistance
Get Started
Current Trends In Database Technology Edbt 2004 Workshops Edbt 2004 Workshops Phd Datax Pim P2panddb And Clustweb Heraklion Crete Greece March 2004 Revised Selected Papers Lncs 3268
Authors: Wolfgang Lindner ,Marco Mesiti ,Can Turker ,Yannis Tzitzikas ,Athena Vakali
2005th Edition
3540233059, 978-3540233053