

Question
This is more like research project. The project question below Note: This exercise include 2 parts Part 1 Obtain data that is quantitative and continuous.
This is more like research project. The project question below Note: This exercise include 2 parts Part 1 Obtain data that is quantitative and continuous. The data gathered must be relevant to something that is of interest to you. Once this data is obtained, you will need to analyze it using strategies/tools we have discussed in class. You can collect data by creating and conducting your own survey that produces quantitative/continuous data or by finding data from a reputable source. If you find the data from a reputable source, it can't be data that has already been analyzed. There are data finding resources available at the end of this document if you wish to use those. There are more details regarding data analysis in the "what will make up your grade" portion of the assignment. Please read all requirements specified in "what will make up your grade" before you being the project. You can use these items and fill in your responses below them, rather than writing this essay style. Purpose: The purpose of this project is to apply what we have learned in context. Being able to analyze data in a basic sense and understand data that has been analyzed is crucial, nowadays. We are regularly subject to information via social media, news, etc. that discusses data analysis (even if it is at a basic level). It is becoming highly common to use basic data analysis to assess things like performance and productivity in the work place. This is true even for non "math" or "STEM" based fields. It is something we all need to have a basic level of understanding in to be informed consumers of information. What will make up your grade: 1. (3 points) The data you chose to explore is quantitative and continuous. You will be expected to explain how you know this is both quantitative and continuous. 2. (2 points) Please explain if your data results are from an observational or experimental study and why. 3. (3 points) You are exploring something you are interested in. To earn credit, explain why you are interested in this topic that you gathered data about. 4. (2 points) You collect at least 20 data values. More specifically, give your survey to at least 20 people or find a source that gives at least 20 non-analyzed data values. Note that non-analyzed means the calculations/graphs in this project have not already been done for you by the source you obtained the data from. Record the raw data you obtain. Meaning list the data in your project. 5. (5 points) Make a histogram or stem and leaf plot for your data. You are welcome to use an online histogram calculator if desired. For the histogram, I will be grading on the criteria of it having a title, correct vertical axis label, correct horizontal axis label, equal bar lengths that show the skew of your data, and that all data is included. For the stem and leaf plot, all data must be displayed consistently in the "stem" and "leaf" segments (as seen in class) and labels much be included. Note that this is being done so you will be able to discuss the skew of the data.
6. (3 points) Discuss the skew of the data based on your histogram. In this discussion of skew you will need to use vocabulary from class. 7. (7 points) Calculate and record the five-number summary for your data. You may use your calculator for this, but I encourage you to show some work too. Showing work demonstrates understanding and guards you from not earning full credit due to a data entry error. 8. (10 points) Calculate and record the mean and standard deviation for your data. Again, you may use your calculator, but I encourage you to show some work too. Showing work demonstrates understanding and guards you from not earning full credit due to a data entry error. 9. (10 points) After calculating both the mean/standard deviation and the 5 number-summary, state which is stronger in giving a more accurate summary of your data. Explain why this is true using the concepts of skewness and outliers. Meaning, use objective reasoning that has been discussed in class to answer this question. Do not use subjective opinion about which measure looks better to you. Note: Keep in mind that to explain using the concept of outliers, it is necessary to test for them to determine if you have any. To earn full credit in this section, you must show your work for this outlier test. 10. (5 points) Summarize the study results. In this summary discuss what the skew, outliers, and summary measures (mean/standard deviation and the five-number summary) mean in context. In context mean in the real-life scenario of this data. Other questions to answer in this summary are: (1) What does the data tell you about the question you asked? (2) Is this surprising to you or consistent with what you would have expected? (3) Can you think of any variables that may confound the study or results? As I would expect for any project, make sure your project is well written. It should be clearly and neatly written (by hand is fine if that is a better means for you) or typed. Each topic addressed above can serve as a heading for each point you are making. Data Resources Here are some resources if you decide to gather data from an outside source rather than conduct a survey. These resources are not extensive, meaning you can gather data from elsewhere. Please be aware that it may take some time and some digging around on these sites to find something that will be both quantitative and continuous, and be of interest. Also be mindful of how many variables our data analysis/summary techniques in this project are meant to represent. Climate Data Note for this data, you will need to use the time series graphs to obtain data values. What you could do is build a histogram to consider the data values over a certain period of time, for example each year for a set amount of 20 years if you want 20 data values. When doing this, you should be mindful of how many variables histograms are meant to represent, the form they take, and set it up appropriately from the link below. ? https://climate.nasa.gov/vital-signs/carbon-dioxide/?intent=121 ?https://climate.nasa.gov/vital-signs/sea-level/?intent=121 ?
Data on Occurrences in the US Population (good for exploring social occurrences): https://ephtracking.cdc.gov/ PEW Research Center Data Sets (various types)https://www.pewresearch.org/datasets/ An Assortment of Data Resources from https://www.whatcom.edu/student-services/tutoring-learning-center/online-math-center/resources/real-data Data from our course material that you can find in the course notes (1) VAERS data (2)Public employee salary data.
Part 2 In this portion of the project I will be giving a data set, and you will need to answer various questions about it. The purpose of this is to allow us to consider multiple variables, and draw conclusions using concepts of skewness and regression. The data set we will use discusses insurance costs based on multiple variables. Here is the data set you will need to use to answer all questions below
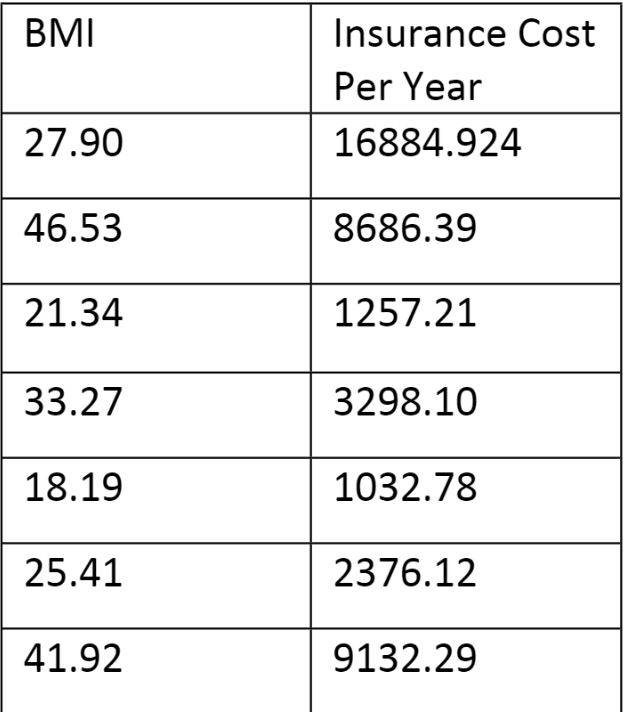
https://www.kaggle.com/datasets/mirichoi0218/insurance. Note that this data set is communicating that the variables displayed are predictors of insurance charges. 1. In the data set, you will see histograms at the top of the columns for the variables age, BMI, children, insurance charges. You will need to interpret what those histograms mean by discussing their skew. a. Age histogram - what skew does this histogram have? What does that mean about the ages of the people studied? b. BMI histogram - why skew does this histogram have? What is the approximate center of the histogram (you do not need to calculate this, you can look at the histogram)? What does this mean about the BMIs of the people studied? c. Number of children - what skew does this histogram have? What does that mean about the number of children people in the study had? d. Charges - what skew does this histogram have? Why does this skewness make sense in a real-world context? When answering this, consider peaks and why that would make sense in the real world. 2. The BMI and insurance charges values from the data set given. Value presented on the table, but reduced the amount of data for easier calculations. Please use the data set (below) to answer the questions below.
Step by Step Solution
There are 3 Steps involved in it
Step: 1

Get Instant Access to Expert-Tailored Solutions
See step-by-step solutions with expert insights and AI powered tools for academic success
Step: 2

Step: 3
Ace Your Homework with AI
Get the answers you need in no time with our AI-driven, step-by-step assistance
Get Started
Elementary Linear Algebra with Applications
Authors: Bernard Kolman, David Hill
9th edition
132296543, 978-0132296540